IT-Conductor vs. AppDynamics

Beyond observability:
End-to-end orchestration and automation for enterprise IT

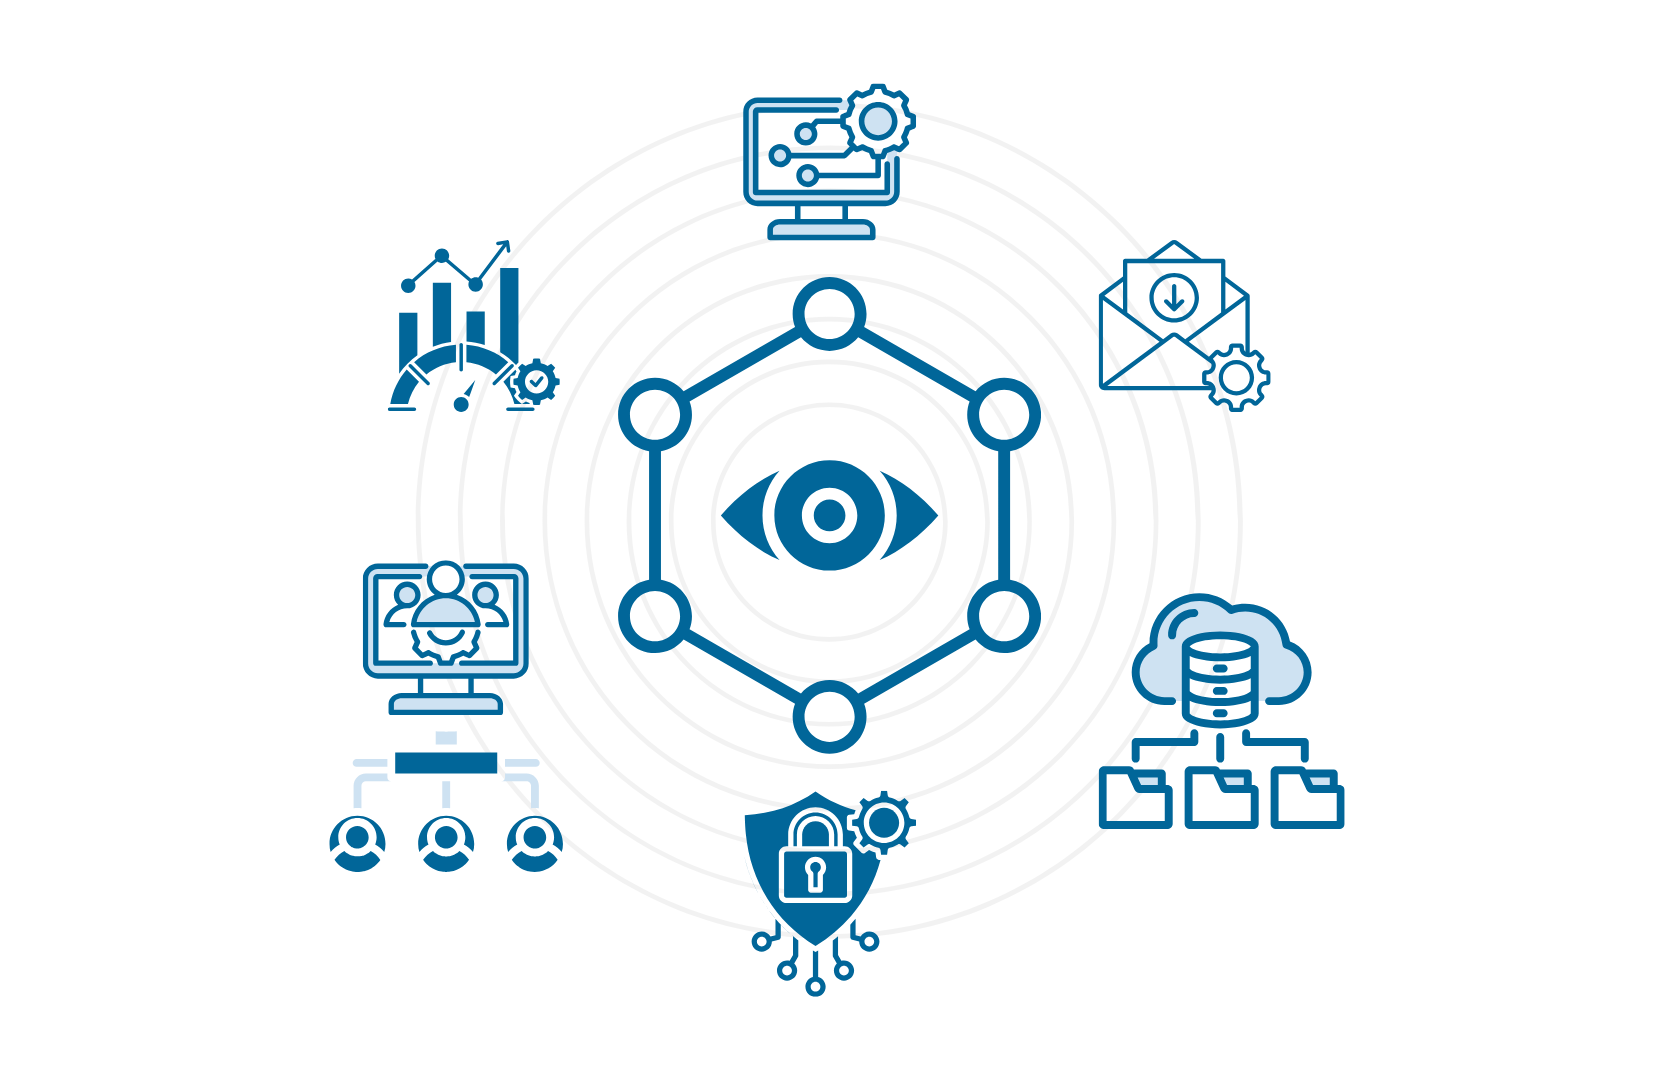
Monitoring without orchestration leaves action to chance. IT-Conductor brings certainty through built-in automation and end-to-end orchestration — turning insights into coordinated actions across complex, hybrid environments.

IT-Conductor Default Dashboard

Does AppDynamics cover all your monitoring and automation needs?

AppDynamics primarily addresses application and infrastructure observability by detecting and analyzing performance issues.

As part of the Splunk Observability portfolio, it integrates with broader Splunk tools for analytics and incident response, but it does not natively provide end-to-end automation or orchestration, so organizations typically rely on additional tools or integrations to automate remediation and operational workflows.

Unified Platform for monitoring IT

Why is observability not enough for modern IT operations?

Observability helps teams detect and analyze issues, but it does not manage the full operational response. While tools like AppDynamics support remediation through policy-based actions, they rely on reactive event triggers rather than proactive, end-to-end workflows needed to coordinate remediation, recovery, and operational processes across complex and hybrid environments.

Which solution best supports your business and IT environment?

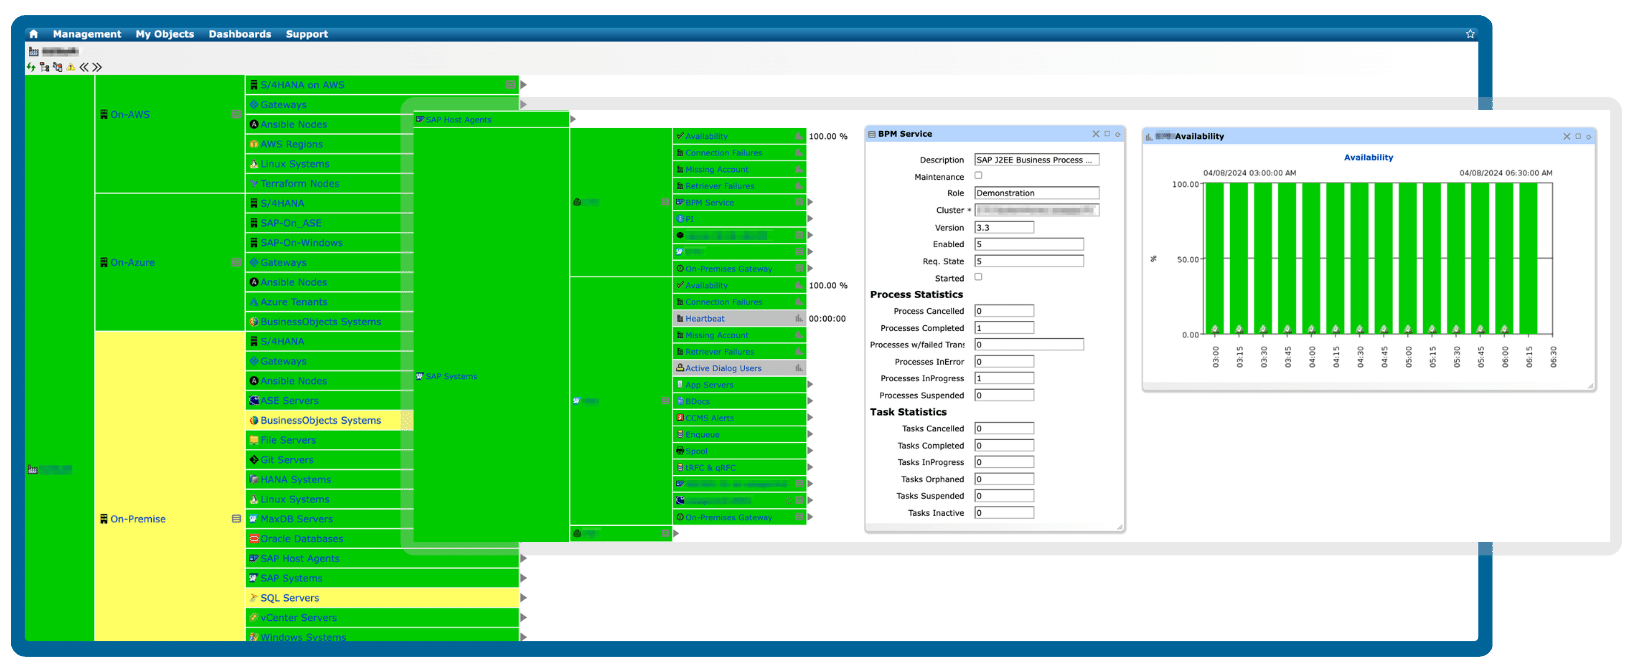
IT-Conductor provides enterprise-wide observability and end-to-end orchestration from a single, unified platform.

See how these two solutions compare to determine the right fit for your enterprise.

  • IT-Conductor

  • AppDynamics

IT-Conductor

Starts at $110 /system per month


Flexible pricing for enterprises of all sizes

CONTACT SALES

AppDynamics

Starts at $75 /host per month


The price shown is an estimated baseline for Splunk Observability End-to-End Edition, comparable to IT-Conductor, not the minimum advertised tier.

LEARN MORE
Architecture and Infrastructure Requirements
  • Cloud-based Service Orchestration and Automation Platform (SOAP) designed to monitor, manage, and orchestrate enterprise IT through intelligent automation
  • Agentless monitoring via reverse proxy for connectivity
  • No hardware installation required
  • Application performance management (APM) platform, delivering full-stack observability as part of the broader Splunk Observability portfolio
  • Agent-based monitoring installed in the OS or application runtime
  • No hardware installation required
Implementation and Deployment
  • Delivered as Software-as-a-Service (SaaS)
  • Works across hybrid/on-prem/cloud
  • Automated landscape discovery with minimal configuration using templates and wizards
  • Requires a Gateway setup to connect to IT-Conductor
  • Delivered as SaaS or on-premises
  • Works across hybrid/on-prem/cloud
  • No single one-click guided wizard that automatically discovers an entire SAP landscape, and requires manual installation and configuration of SAP agents and components
Performance Metrics and Collection Methods
  • Agentless collection via standard protocols (i.e., SNMP, WMI, JMX, JDBC, and REST APIs), with SAP ABAP metrics collected through standard SAP APIs/RFCs, including CCMS and custom function modules
  • Supports wide SAP landscapes (SAP ABAP (S/4HANA, BW/4HANA, ECC, CRM, BW, SRM, Gateway, SCM, Solman), SAP JAVA (PI/PO, Solman, Portal), BOBJ, BODS, WebDispatcher), and OS/DB components
  • Retrievers determine the method and frequency of metric collection
  • Each metric and alert has an associated class
  • Agent-based collection via application, machine, and SAP-specific agents
  • Supports SAP ABAP monitoring via SAP ABAP Agent
  • SAP HANA monitoring requires additional configuration
  • Uses self-learning, dynamic baselines that automatically adapt to periodic load patterns for each metric
  • Supports creation and customization of metrics to meet specific monitoring requirements
Availability and Service Monitoring
  • Supports ping, logon, synthetic checks, and URL/HTTP availability monitoring for websites and service endpoints
  • Captures availability even when the managed system is offline through an external heartbeat that monitors from the outside in
  • Context-aware availability monitoring that identifies real outages while filtering minor fluctuations
  • Flexible, customer-defined availability models, including custom checks and threshold parameters
  • Supports end-to-end monitoring for services, business processes, and transactions
  • Supports transaction monitoring to test end-to-end user experience
  • Drill -down capability across hierarchical service layers for root-cause correlation and in-depth analysis
  • Adaptive monitoring that automatically correlates events across layers to reduce alert fatigue
  • Supports synthetic monitor using AppDynamics Synthetic Monitoring (HTTP, browser, API checks)
  • Captures availability by synthetic test outcomes and rule evaluations rather than low-level protocol polling
  • Supports end-to-end transaction monitoring across application tiers
  • Supports Real User Monitoring (RUM) provide user-experience visibility (depending on licensing)
  • Provides deep drill-down for performance analysis via business transaction snapshots, cross-tier flow maps, and detailed call graphs that trace execution from high-level transactions through application tiers and backend components
  • Health-rule and policy-based correlation across application tiers to minimize alert noise
Thresholds Management
  • Static, dynamic, and standard deviation thresholds with flexible, rule-based targeting
  • Thresholds triggered by aggregates, averages, min/max values, and intervals, with custom severity levels
  • User- or role-based overrides to influence state changes in monitored instances
  • Time-synchronized data with Health Explorer for root-cause analysis (RCA) and troubleshooting
  • Uses both self-learned baselines and configurable thresholds to identify application issues
  • Thresholds are evaluated via health rules using aggregated metric values over configurable time windows
  • Severity levels (i.e., Warning, Critical) are defined through health rule conditions and policies
  • Threshold evaluation applies across application tiers and business transactions, leveraging learned baselines to reduce false positives
  • Health rule violations provide contextual access to transaction snapshots and flow maps, enabling cross-tier root-cause analysis and troubleshooting
Alerts and Notifications Management
  • Advanced, policy-based notifications with dynamic group targeting, schedule- and severity-based delivery
  • Notification channels include email and SMS, with integration to ITSM and team collaboration tools via webhooks and API
  • Supports threshold-based escalations that trigger alerts only when occurrences exceed a set limit
  • Policy-based alerting driven by health rule violations, with notification delivery based on severity level and event type
  • Notification channels include email and SMS (configured via Alert & Respond), as well as webhook/HTTP integrations to ITSM, incident management, and collaboration tools
  • Alert policies can enforce sustained-violation conditions, ensuring notifications are triggered only when health rule violations persist beyond a defined evaluation window
Automation and Orchestration
  • Intelligent, context-aware recovery actions, designed to automatically remediate known events and recurring issues
  • Cross-platform execution of commands and custom scripts
  • Graphical, interactive process design for creating automated IT and business workflows
  • Resource provisioning and configuration via DevOps workflows and Infrastructure-as-Code (IaC) (i.e., Ansible and Terraform)
  • End-to-end orchestration of complex IT and SAP environments, enabling intelligent automation of monitoring events, recovery actions, and workflows across on-prem and cloud platforms
  • Policy-based automated actions triggered by health rule violations
  • Supports custom actions intended to trigger external systems (i.e., third-party alerting and ticketing systems) or workflow/automation tools via integration modules, webhooks, and API calls
  • Does not provide a native graphical workflow or process orchestration
  • No native Infrastructure-as-Code (IaC) execution or resource provisioning
  • No native SAP landscape automation for Basis activities (i.e., system copy, end-to-end system refresh, transport management)
Reporting and Analytics
  • Interactive, role-based dashboards with KPIs and metrics customized per function
  • Predefined and custom report templates, tailored to specific operational needs
  • Scheduled report generation with automated delivery via multiple channels
  • Supports HTML, PDF, and other export options
  • Historical archiving for baseline comparison, compliance, and troubleshooting
  • Role-based dashboards displaying application, infrastructure, and user-experience KPIs
  • Predefined scheduled reports and supports custom report creation
  • Scheduled report generation with automated delivery via email
  • Supports PDF, CSV, and JSON export options
  • Historical archiving for baseline calculation, trend analysis, and troubleshooting
Usability and Accessibility
  • Minimal expertise required to get started
  • Web-based access from anywhere
  • Role-based access control for secure permissions
  • Moderate technical expertise required for initial setup, including agent installation and configuration
  • Web-based user interface accessible via browser for SaaS and on-prem deployments
  • Role-based access control with granular permissions scoped by application, dashboard, and functionality
Support and Documentation
  • Multi-channel support
  • Always-on support for maximum system reliability with expert guidance
  • SLA-based response time for issues and inquiries
  • Onboarding and training sessions to accelerate adoption and proficiency
  • Knowledge base with regular updates
  • Multi-channel support
  • 24×7 support available for eligible subscription tiers, providing access to technical experts
  • SLA-based support response times defined support plans and case severity levels
  • Onboarding resources, product training, and enablement available through Splunk Education and professional services
  • Knowledge base with regular updates

One platform to monitor, manage, automate, and orchestrate IT

Achieve a holistic view of your applications, services, and IT infrastructure consolidated into one intuitive interface.

IT-Conductor Service Grid
BROCHURE

Grab this file to review an overview of our solutions at your convenience and share it with your team anytime

Transform your operations with intelligent workflows, proactive monitoring, and robust scalability. By minimizing noise and maximizing performance, your team can focus on strategic initiatives.

TESTIMONIALS

What our customers say

We had the monitoring of our SCM system up and running within a single collaborative web session. The IT-Conductor team was able to capture specific details of long-running jobs and queue failures, which provided actionable short-term fixes, while recommending auto-recoveries for queues that were only possible via manual intervention previously. The manpower saving and quick MTTR that could be realized was obvious, especially when IT-Conductor can automate it 24x7.

As part of Under Armour’s SAP migration to AWS, automation was identified as a top priority to ensure we leverage best practices in standardized deployment and use industry-leading tools to automate SAP IT Operations processes. IT-Conductor fits nicely into the solution mix, being an AWS SaaS Marketplace platform and a deep automation specialist.

FAQs

Need clarification?

Which solution aligns better with enterprise-wide IT monitoring and automation strategies?

For enterprise-wide IT monitoring and automation strategies, a platform that combines observability with native automation and orchestration aligns better. While AppDynamics focuses primarily on application and performance observability with reactive, policy-based actions, IT-Conductor is designed to unify monitoring, management, automation, and orchestration of enterprise applications, services, and infrastructure in a single platform.

Can I use IT-Conductor with AppDynamics?

Yes. IT-Conductor can work alongside AppDynamics and other existing monitoring tools without conflict. However, direct integration is currently not provided.

Which tool requires less effort to onboard IT environments of varying complexity?

IT-Conductor generally requires less effort to onboard IT environments of varying complexity because it uses an agentless architecture, guided discovery, and predefined templates.

In contrast, tools like AppDynamics require agent deployment and environment-specific configuration, which can increase onboarding time as complexity grows.

Subscribe to the IT-Conductor Newsletter

Get insights on the latest trends in tech, product updates, and industry perspectives delivered straight to your inbox.