Application Performance Management Solution
Orchestrate and simplify complex IT operations with our remote agentless monitoring and application performance management platform, empowering organizations to manage diverse environments with minimal overhead and maximum visibility efficiently.
![]()

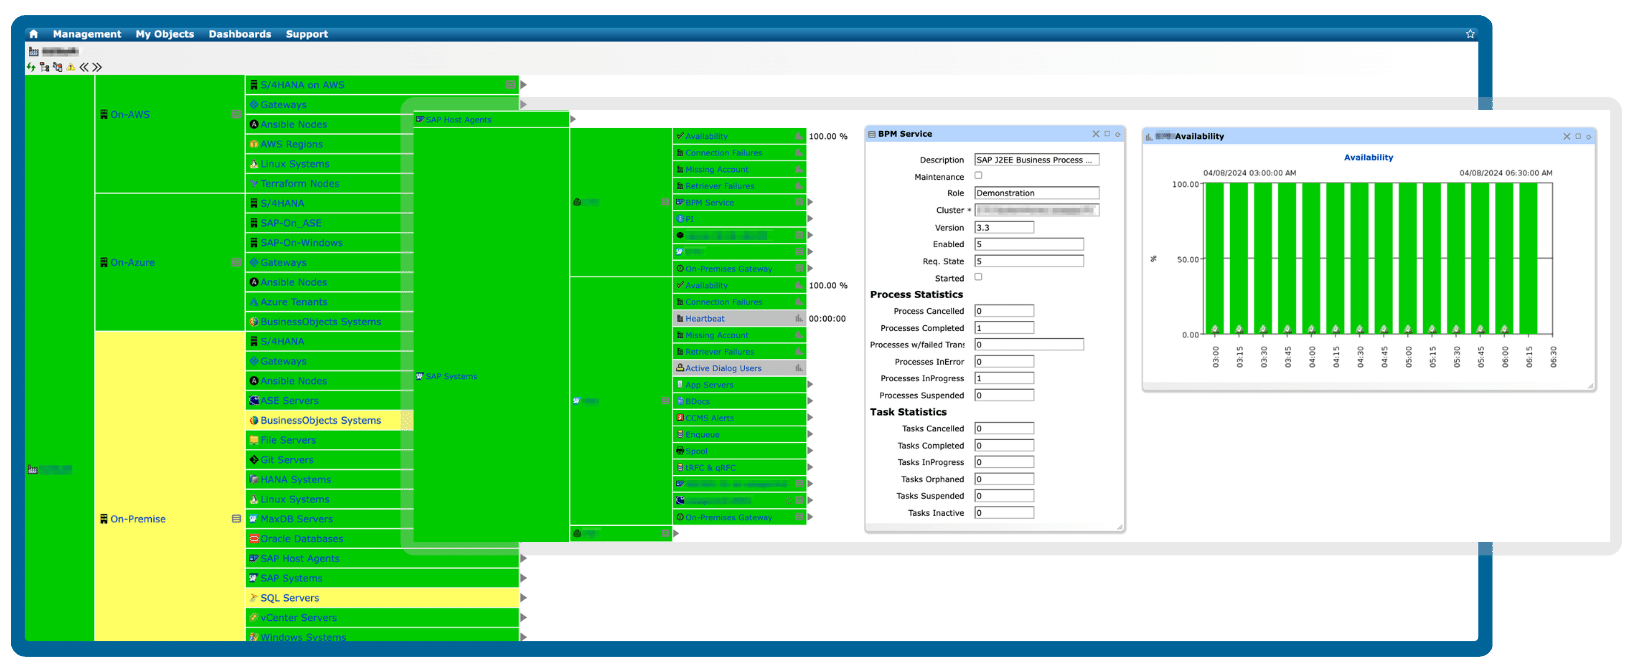
Unparalleled APM Solution for any environment
IT-Conductor provides deep insights and advanced visibility into how your entire system landscape is performing to help you better understand, optimize, and troubleshoot your applications. By understanding how application performance impacts your customers, you can make better decisions that will improve the overall experience for everyone.
Database
$110/system
1-year plan: $99 per month
2-year plan: $88 per month
3-year plan: $82.50 per month
-
 HANA, ASE, Oracle, MSSQL
-
OS monitoring
-
Notifications
-
Dashboards
-
Reporting
-
Automated Recoveries
Non-production
$220/system
1-year plan: $198 per month
2-year plan: $176 per month
3-year plan: $165 per month
-
SAP Netweaver, BOBJ, and cloud apps
-
No native DB or OS monitoring
-
Notifications
-
Dashboards
-
Reporting
-
Automated Recoveries
Production
$550/system
1-year plan: $495 per month
2-year plan: $440 per month
3-year plan: $412.50 per month
-
SAP Netweaver, BOBJ, and cloud apps
-
DB, OS, and cloud monitoring
-
Notifications
-
Dashboards
-
Reporting
-
Automated Recoveries
