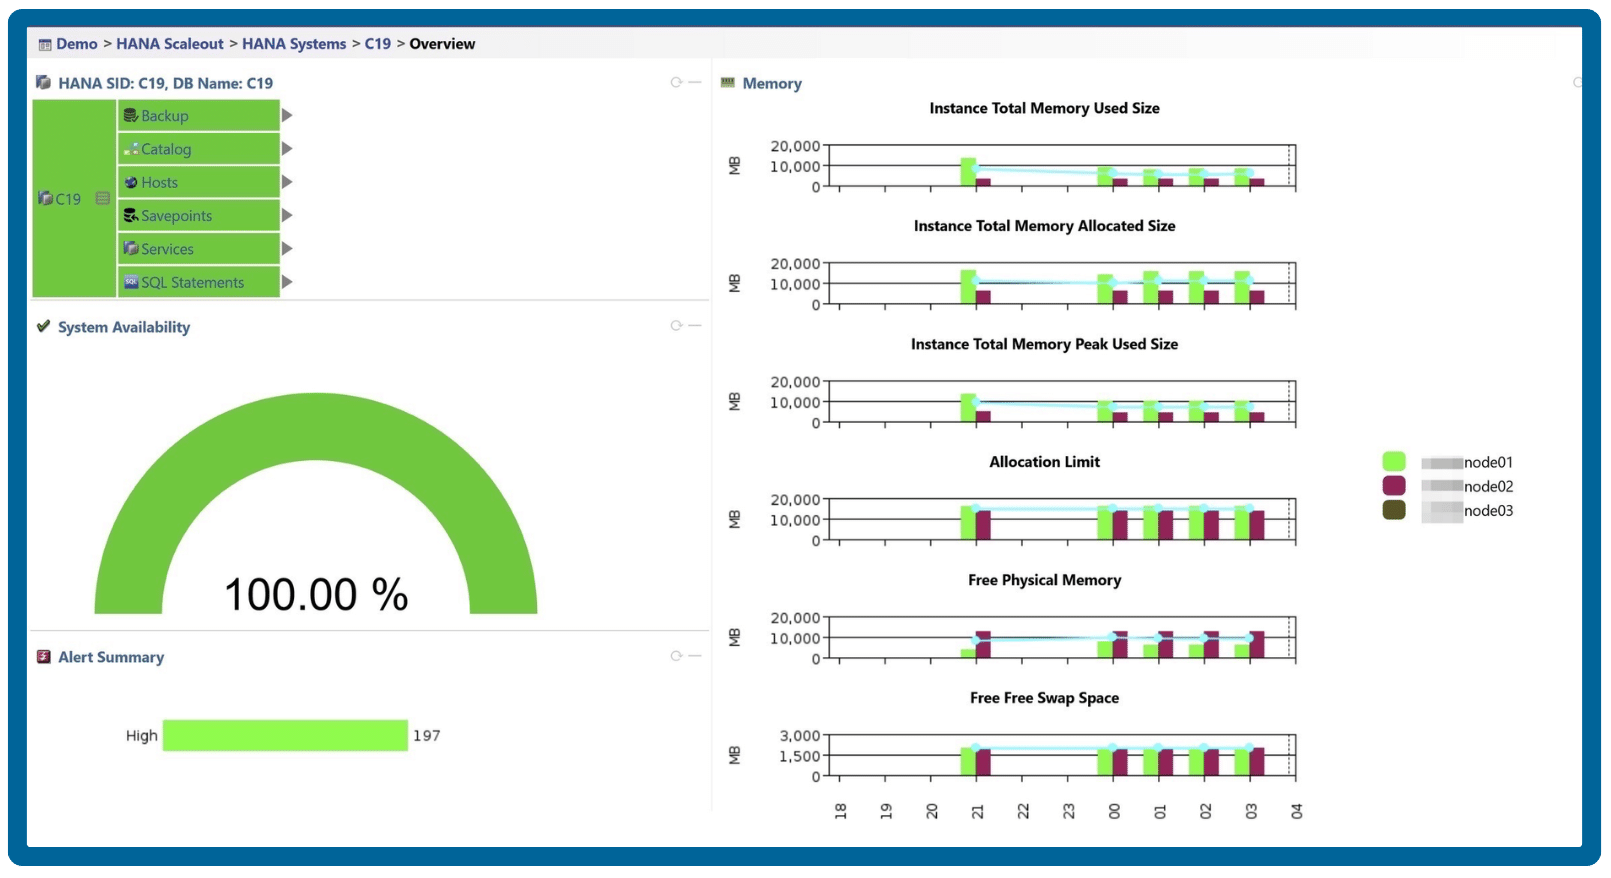
Database Monitoring
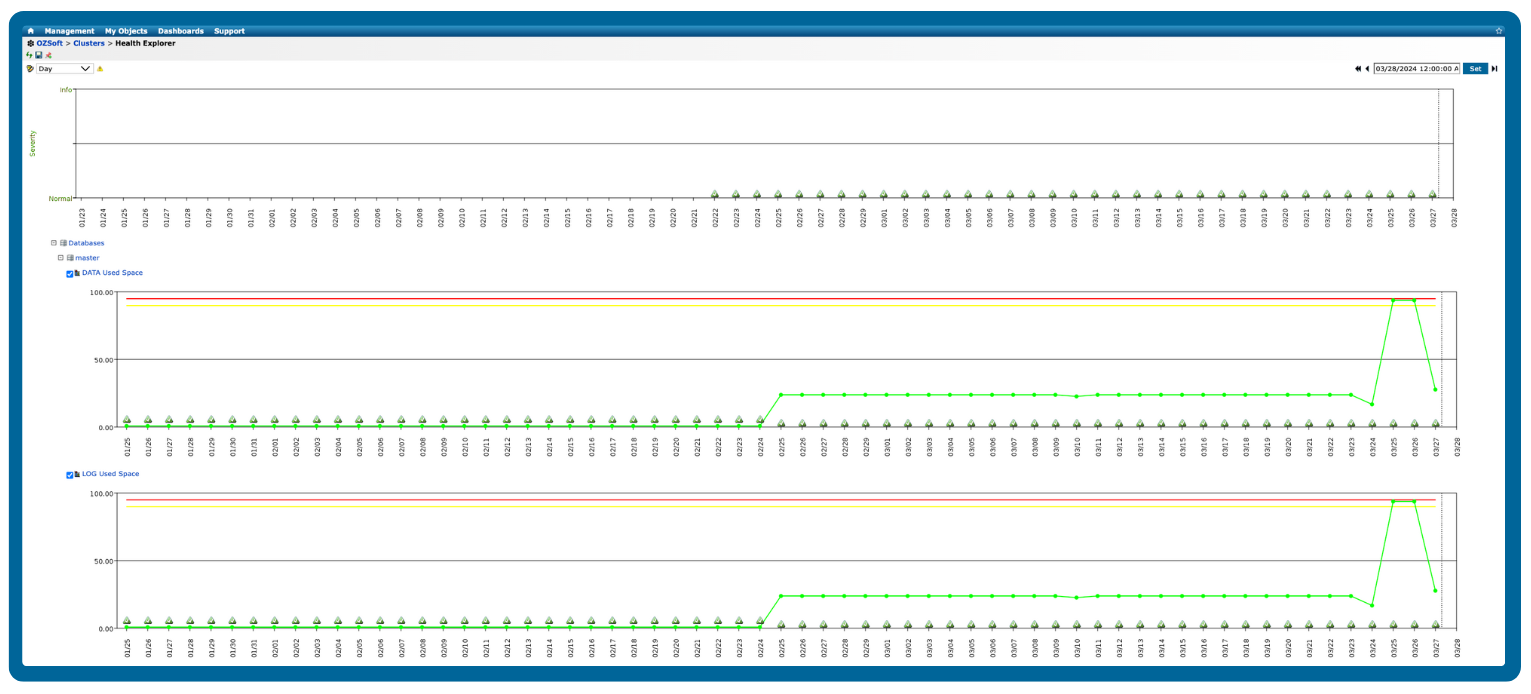
Achieve optimal efficiency and reliability for your data infrastructure with advanced monitoring and performance management. Proactively monitor database metrics and trends to mitigate risks and ensure business continuity.
![]()


Database
$110/system
1-year plan: $99 per month
2-year plan: $88 per month
3-year plan: $82.50 per month
-
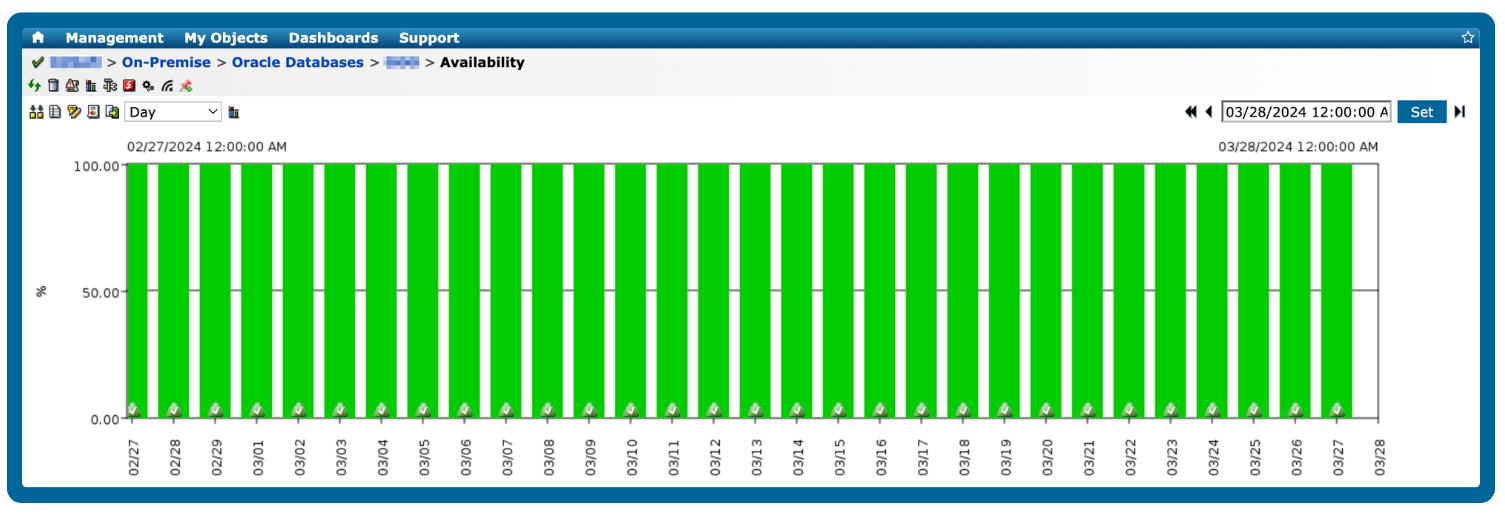
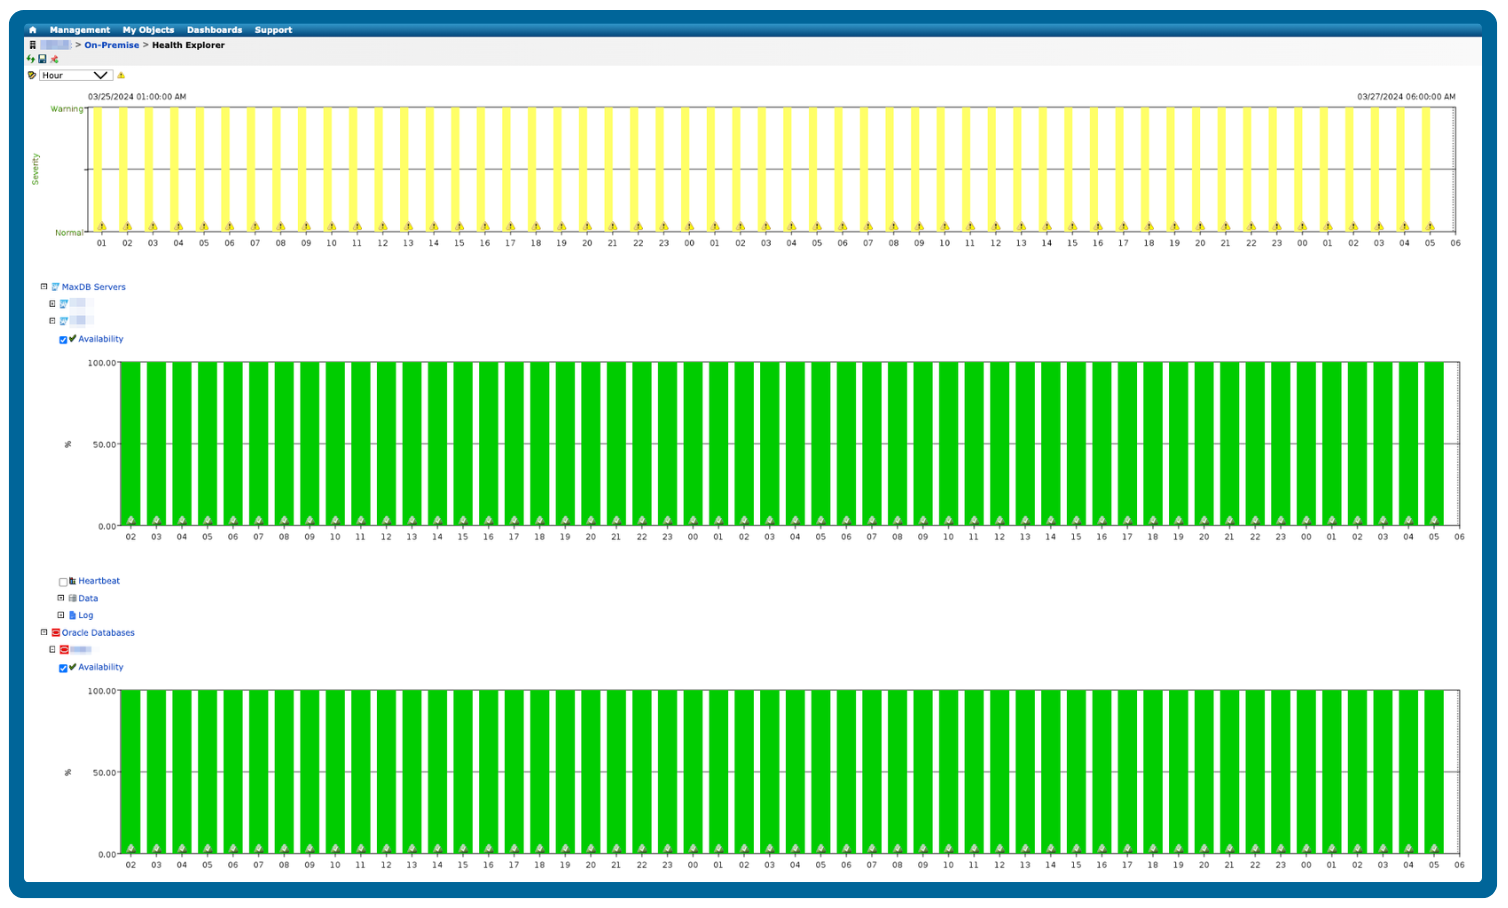
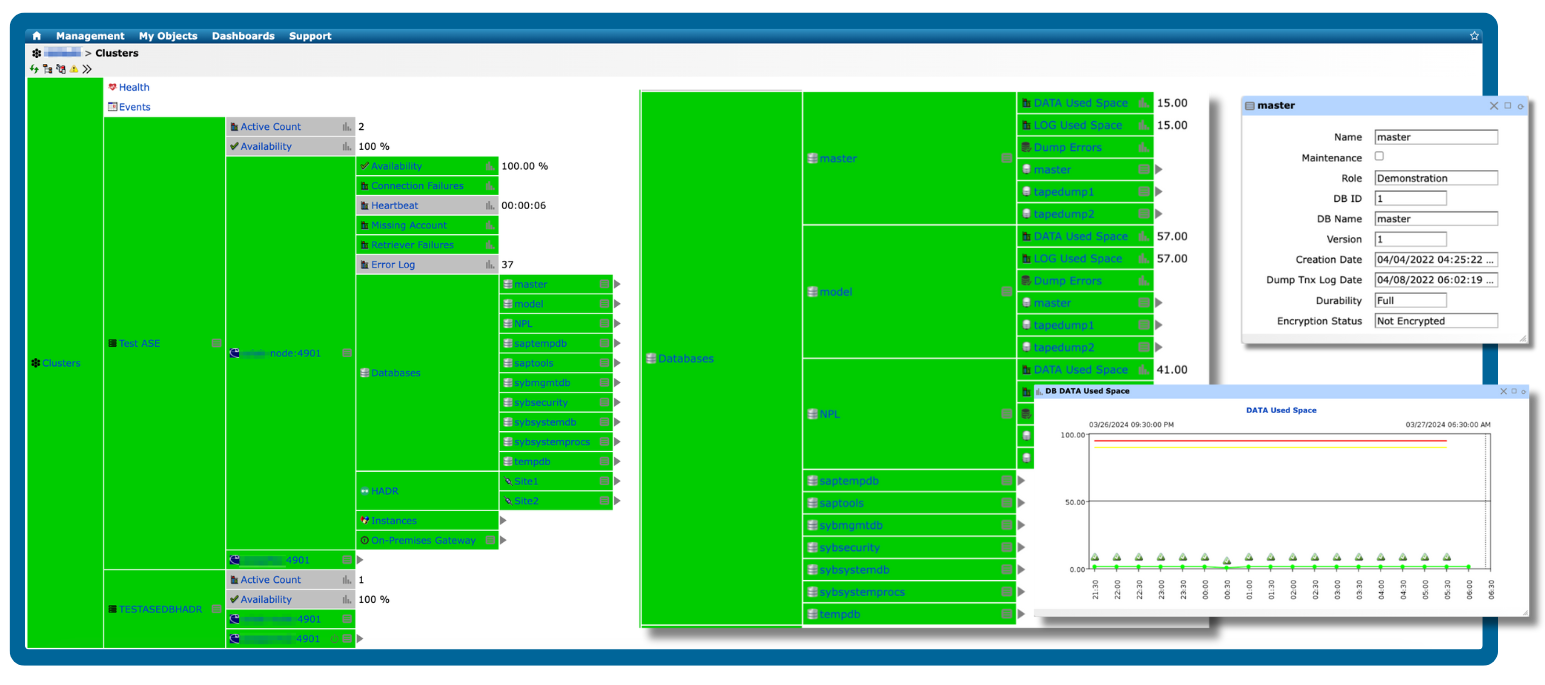
 HANA, ASE, Oracle, MSSQL
-
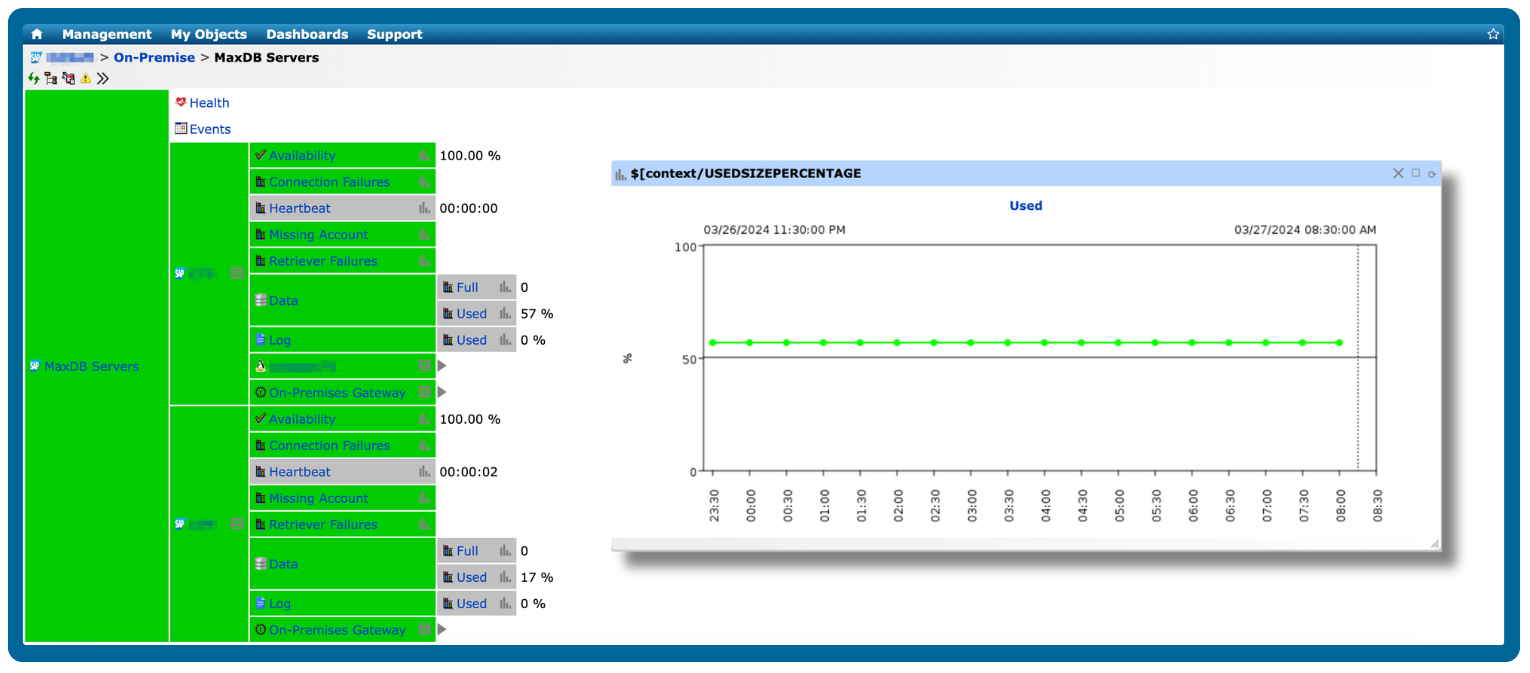
OS monitoring
-
Notifications
-
Dashboards
-
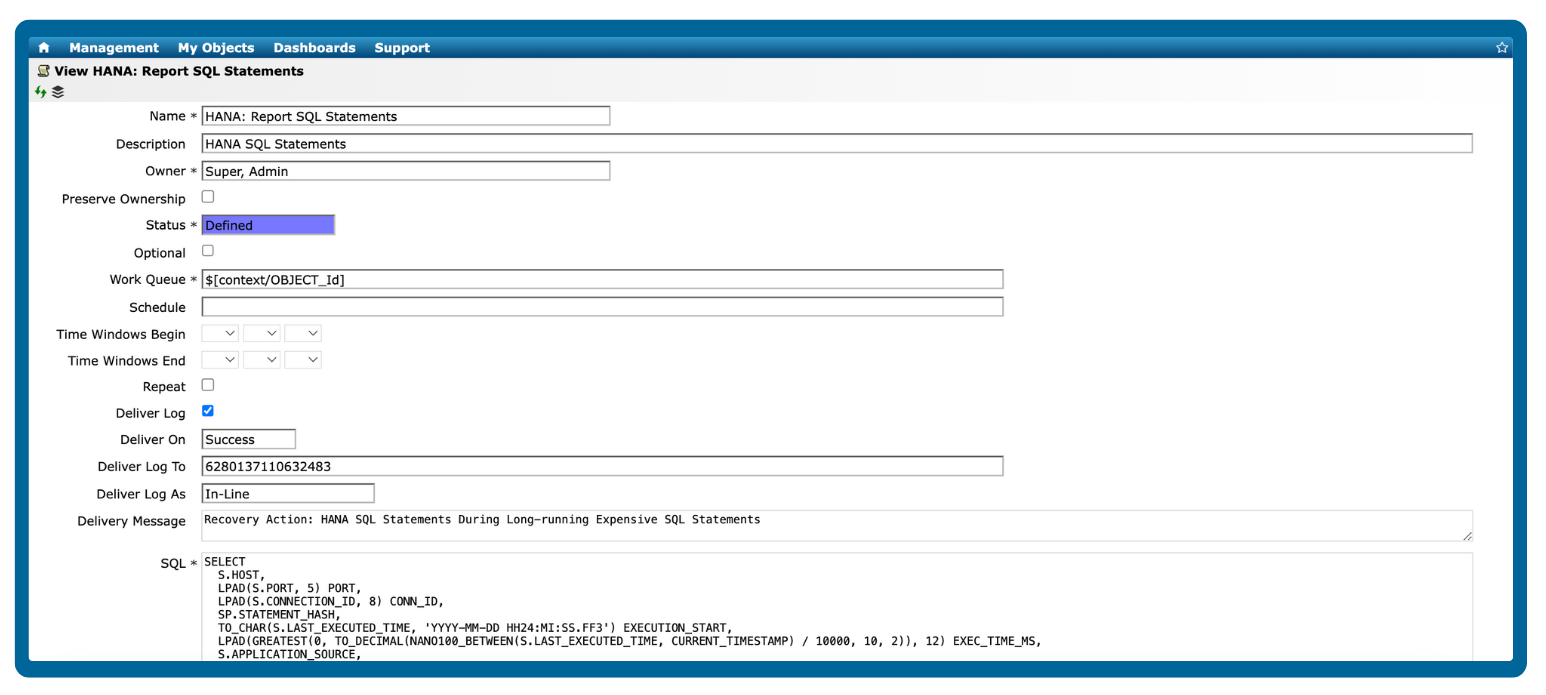
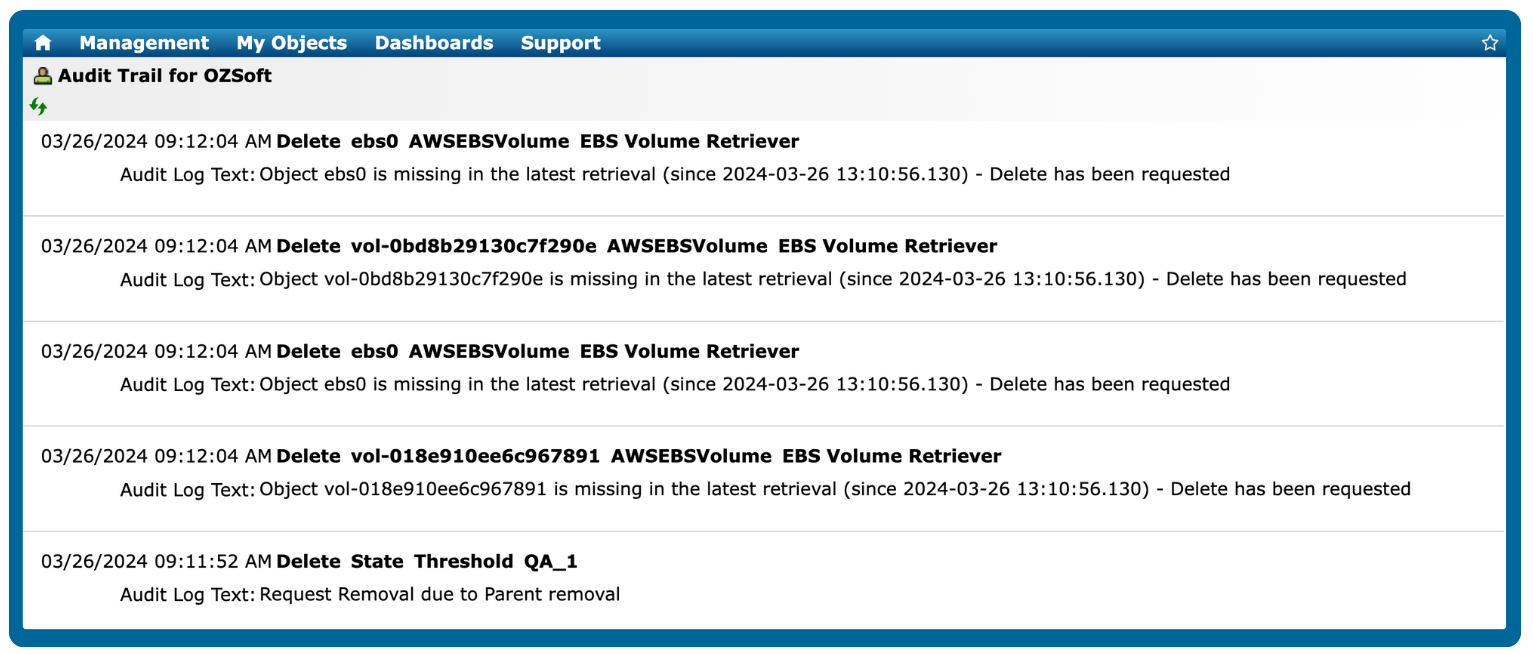
Reporting
-
Automated Recoveries
Non-production
$220/system
1-year plan: $198 per month
2-year plan: $176 per month
3-year plan: $165 per month
-
SAP Netweaver, BOBJ, and cloud apps
-
No native DB or OS monitoring
-
Notifications
-
Dashboards
-
Reporting
-
Automated Recoveries
Production
$550/system
1-year plan: $495 per month
2-year plan: $440 per month
3-year plan: $412.50 per month
-
SAP Netweaver, BOBJ, and cloud apps
-
DB, OS, and cloud monitoring
-
Notifications
-
Dashboards
-
Reporting
-
Automated Recoveries