SAP HANA Monitoring
Configuring and Monitoring SAP HANA 2 Extension Node
Configuration and Monitoring of SAP HANA 2 Extension Node suitable for Native HANA and BW scenarios in managing warm storage
SAML SSO, OKTA, HANA System Replication (HSR) Takeover, HANA Embedded Livecache, Pacemaker, WebUI

In view of customers’ requirements and our commitment to delivering intuitive functionalities, more useful tools and features have been added to the IT-Conductor platform to enable better service delivery, Minimize Noise > Maximize Performance. You will find these new features useful for administration, analysis, and reporting
We have added to this growing list of features by introducing new monitoring features for the effective monitoring of your entire System Landscape.
A few of these newly added features include:
IT-Conductor now supports SAML SSO, which allows for a login without explicit authentication when SAML Security Provider is configured. This has been extensively tested with Okta, Google, etc. This functionality is officially validated with OKTA and features on their approved applications list.
Benefits: Increases productivity and security, reduces risks and help desk costs, accelerates user adoption of new apps, and improves user experience.
While logged in to IT-Conductor, setup per instructions in menu Support → Help → SSO (https://service.itconductor.com/help?itconductor.id=config/SAML)
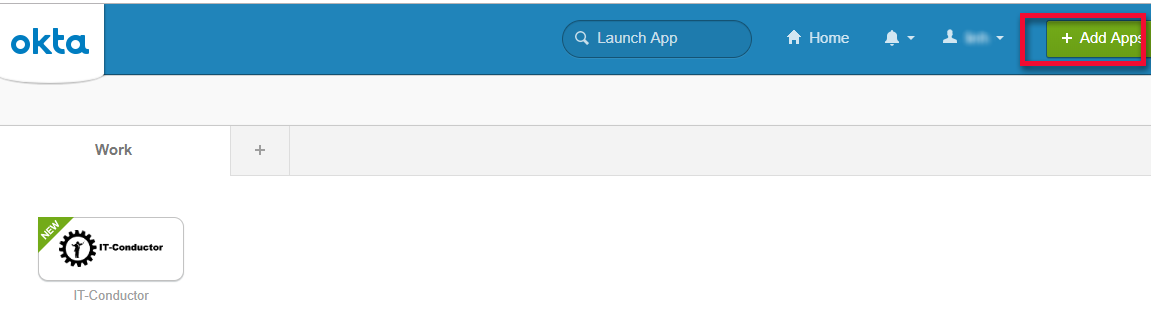
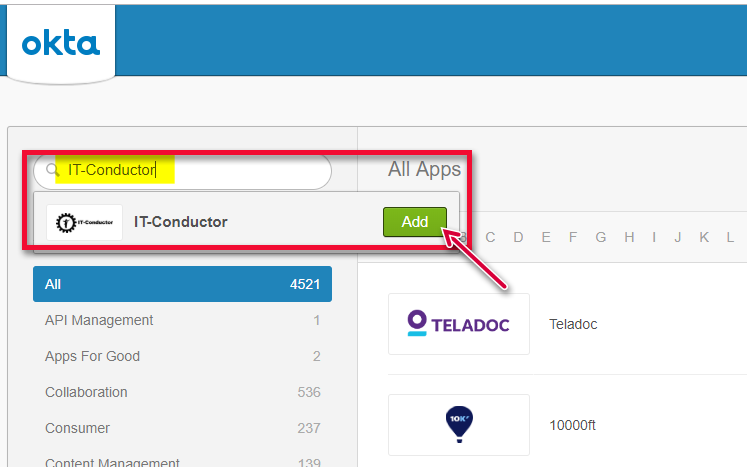
In your company's OKTA account, you can add IT-Conductor as an App by searching and adding to your Home screen (see below):
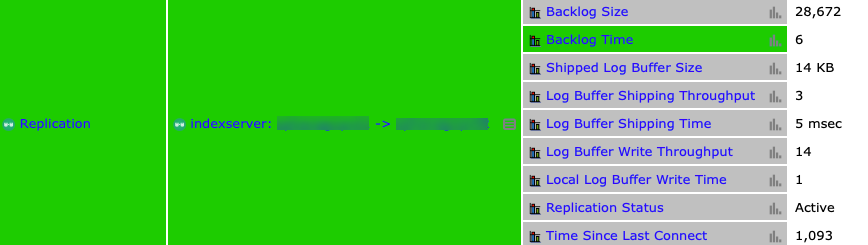
In addition to the standard monitoring of the HANA database that IT-Conductor provides, there is now the addition of improved Replication Monitoring that captures Takeover events.
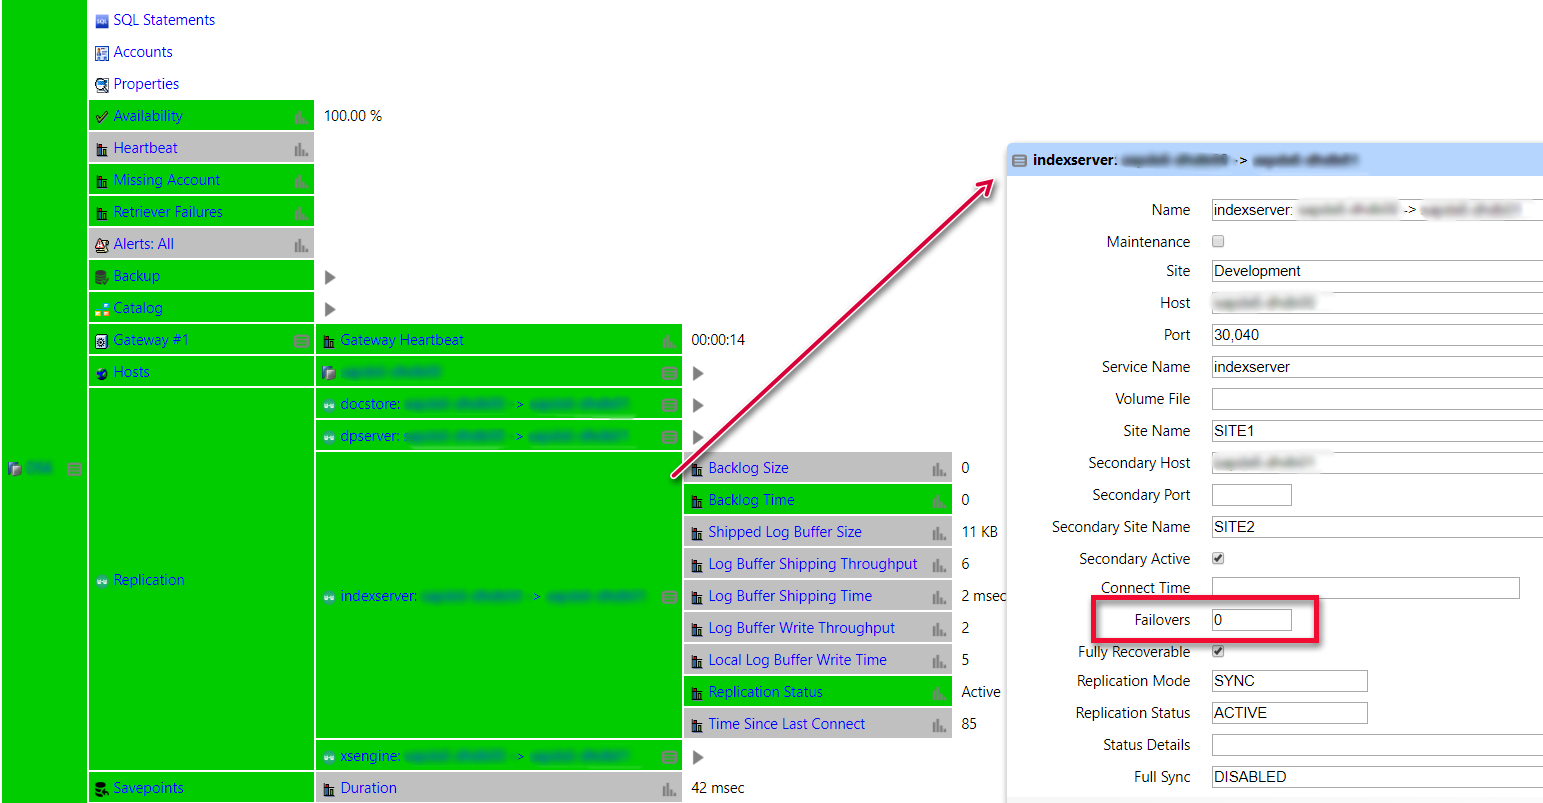
Figure 3: IT-Conductor-HANA-HSR-Failovers
When a takeover occurs, IT-Conductor 'automatically' shifts the monitoring and replication status (once re-established), based on the 'new' primary system. Replication status is monitored in IT-Conductor using the details below:

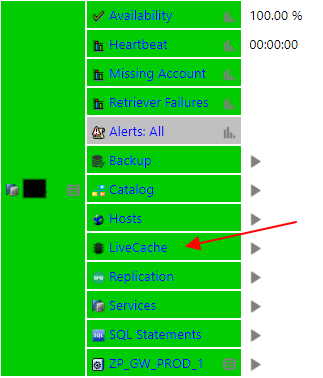
Another important feature under this category is the LiveCache monitoring which consists of Containers Storage & Locks Duration.
This feature can be enabled for customers on-demand.
Pacemaker is widely used opensource clustering for Linux high-availability, especially for SAP customers running on SUSE and Redhat platforms. There is lack of any enterprise SAP monitoring solution which includes the Pacemaker cluster monitoring, so visibility into the underlying High Availability (HA) components and resource status such as HANA resource agents and ASCS/ERS resources precludes HA Health.
When Pacemaker features are enabled for your Pacemaker cluster Linux monitoring, IT-Conductor can provide centralized monitoring of all cluster nodes, cluster resources, cluster messages which can trigger alerts to let you know of resource stop/start/monitor failures. This is extremely important to know since your RTO and RPO may be severely at risk even if your SAP and Database are running OK, however overall they are unhealthy when the cluster is not in the right state for failover if a disruption should occur.
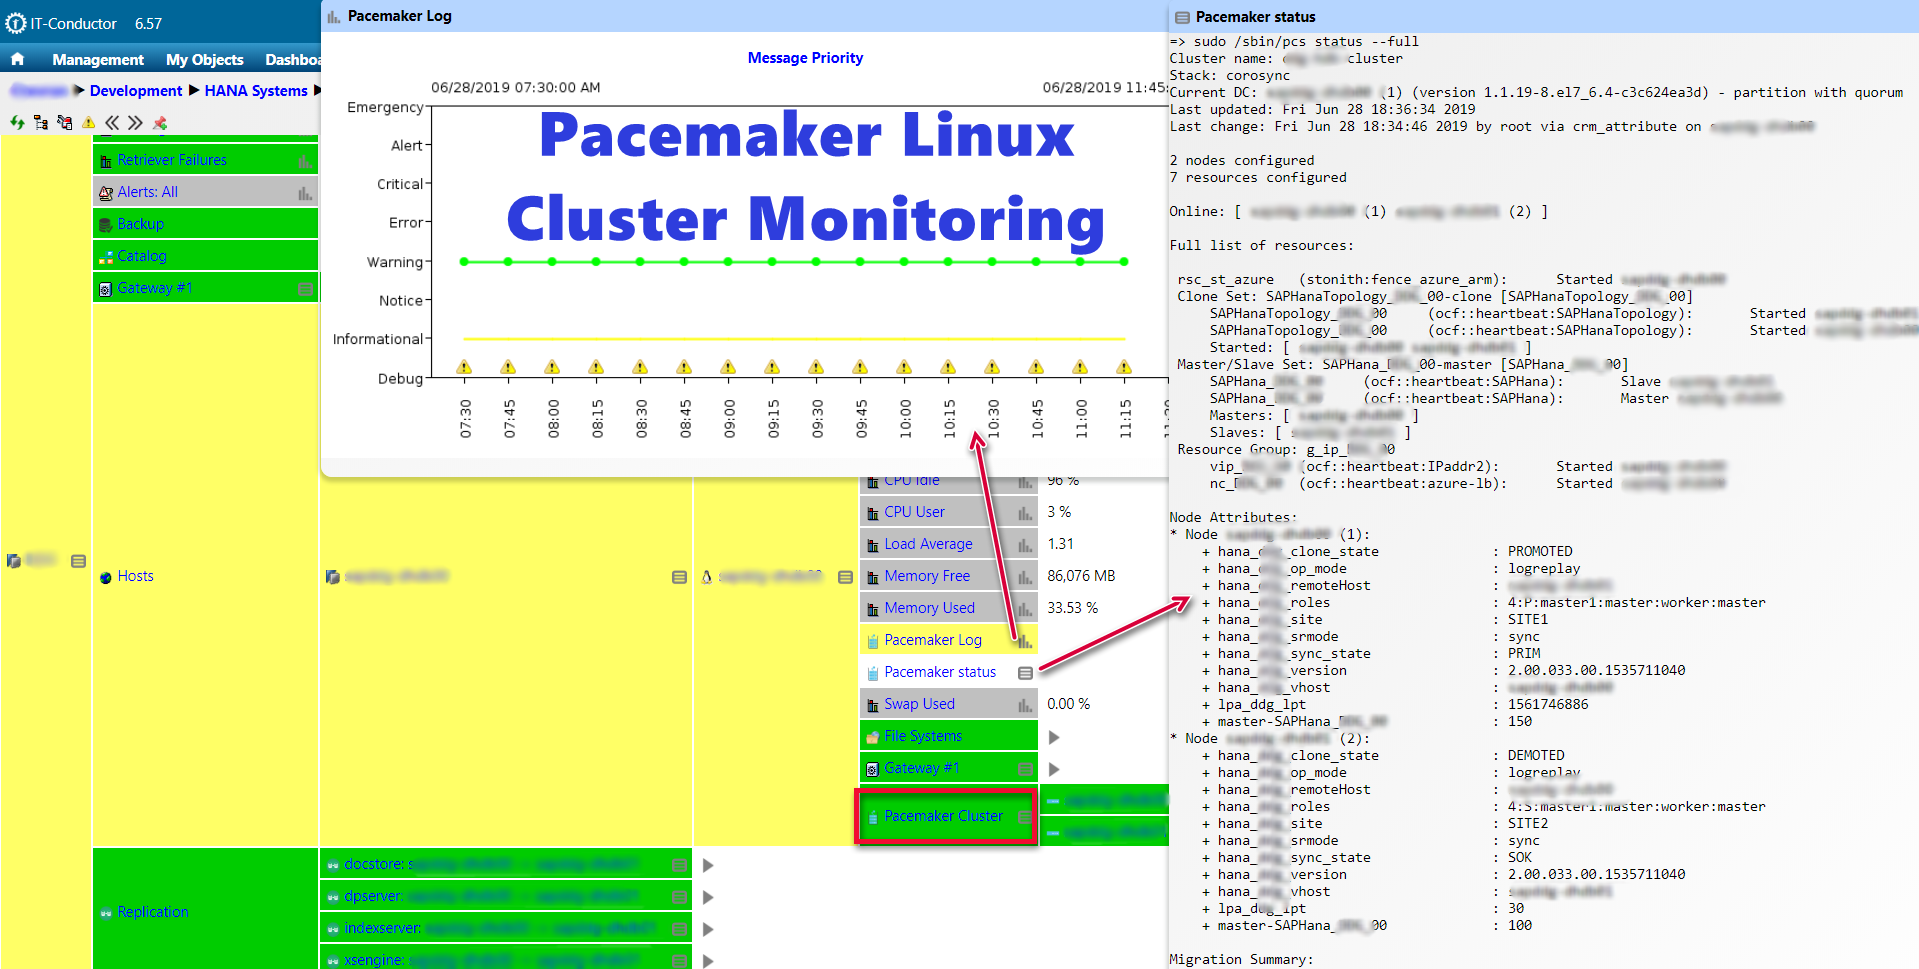
Figure 6: IT-Conductor-Pacemaker-Quickview
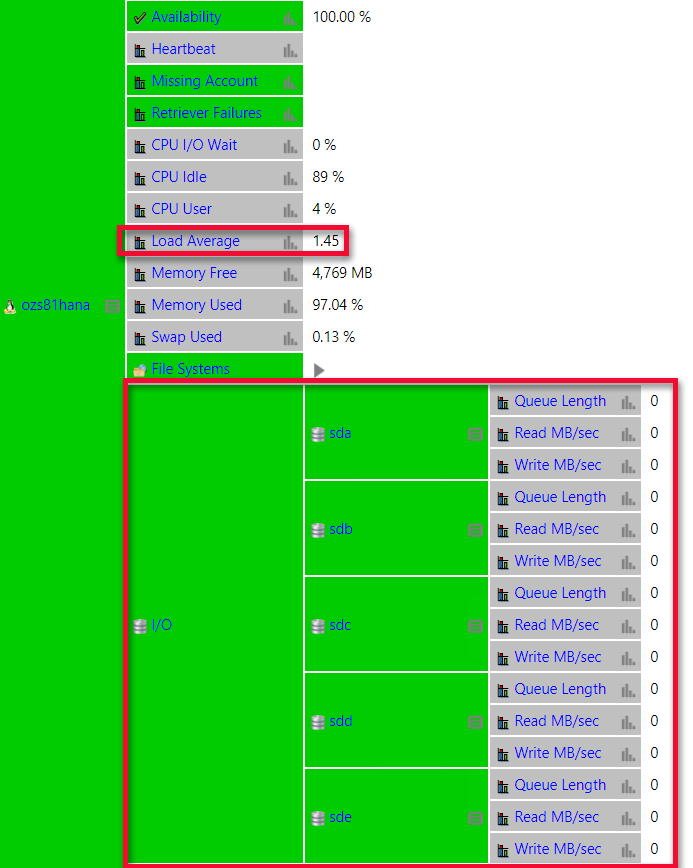
The performance report of your Linux servers is vital for capacity planning, prevention of server failures, proper maintenance of your servers, etc, and it's important that it comprises of critical performance metrics that will give a dynamic view of the health of your Linux server as well as useful insights into the state of your Linux servers. These critical metrics have been included in IT-Conductor to ensure efficient operational status.
Gauge charts have been implemented to represent percentage or min/max values as a Doughnut or clock-style gauge. This is often used in executive dashboard reports to show key performance indicators and to determine whether values are within/outside forecast margin. They can also be used to visualize a value relative to one to three data ranges.

Figure 8: IT-Conductor-DonutChart-Categories
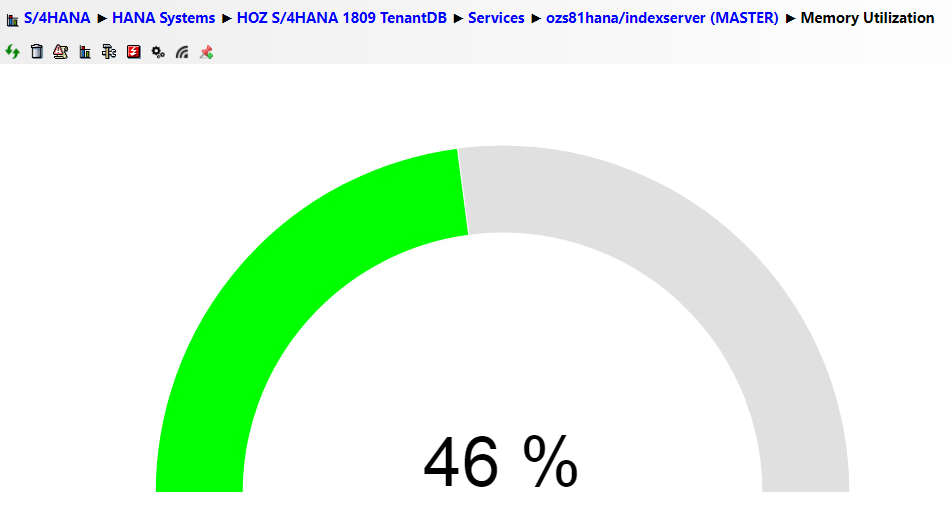
Figure 9: IT-Conductor-DonutGauge-MonitorThreshold
The chart popups are now 'automatically' refreshed every 60 seconds and make the best use of screen estate within the popup space, even after a resize of the pop-up by dragging the chart's bottom right corner. The charts also allow for zooming in when you click on time values. This gives an updated view of the status of your systems, while having as many pop-ups as you like on the screen which are frequently updated.
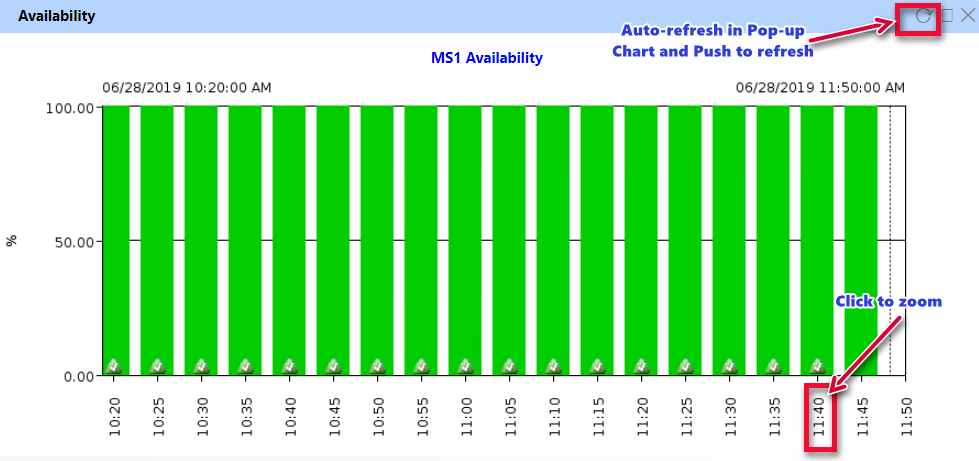
Figure 10: IT-Conductor-ChartPopupwithRefreshandZoom
Grid controls have been added to either increase or decrease default expansion depth/level. This allows you to quickly drill down to the root cause of the problem.
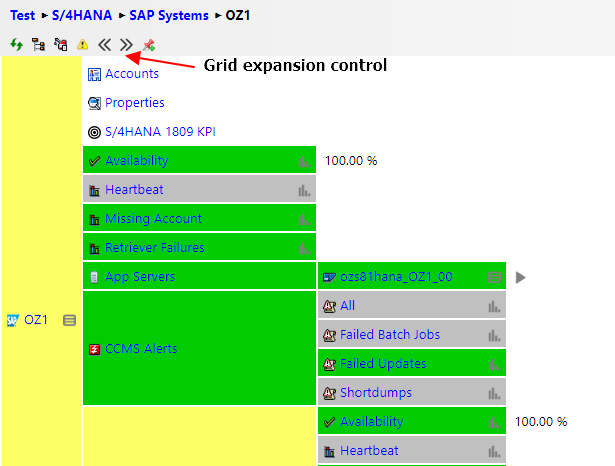
Figure 11: IT-Conductor-Grid-Expansion-Control
Go ahead and give these new features a try in your account, or if you would like to try IT-Conductor:

Configuration and Monitoring of SAP HANA 2 Extension Node suitable for Native HANA and BW scenarios in managing warm storage
How to monitor SAP HANA in HA/DR Configuration with System Replication
Let's not just Monitor HANA, but also Manage and Automate the HANA Monitoring