According to SAP, Process Orchestration (SAP PO) is a tool to model and design business processes, primarily used to integrate SAP systems and external systems. There can easily be confusion with interchanging terms used, XI (Exchange Infrastructure), PI (Process Integration), and PO (Process Orchestration), but really they are all the same thing, just SAP evolution over time with increased functionality. In this publication, we will summarize the main difference and how to simplify the SAP monitoring of this increasingly important glue that holds together an SAP-based ecosystem.
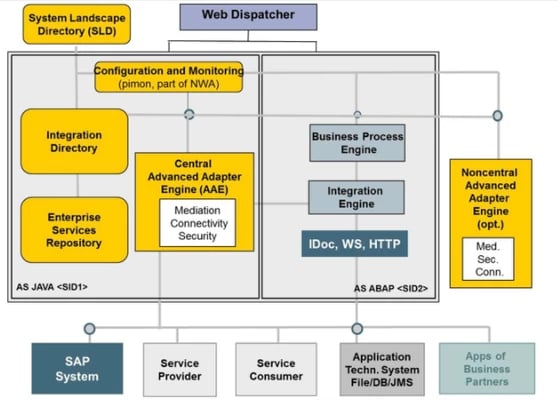
For those of you who have worked with early renditions, it was called XI, an SAP Netweaver dual-stack application designed to synchronize data between different systems such as orders between ECC and CRM. The adapters are what make the data exchange possible between systems (similar to EDI or iDocs concepts), and thus there was born the Adapter Framework (AF) running on an engine called Integration Server (IS).
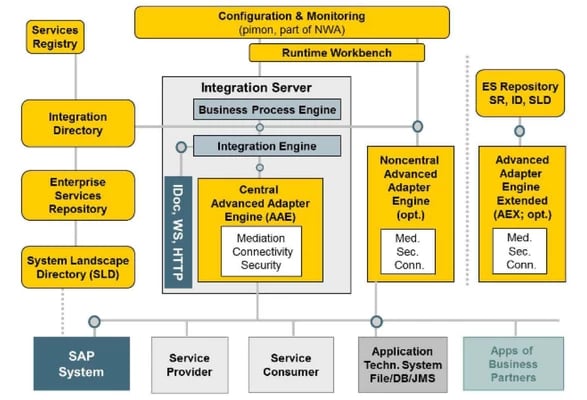
Over time, XI became PI, pretty much the same thing just with upgraded functionality - more adapters and integration scenarios. Now with Netweaver 7.4-7.5, PO replaces PI, although still collectively known as PI/PO. However, PO improves upon PI with the inclusion of the 'Process' capabilities to model business processes (BPM - Business Process Monitoring) and the mixing of various adapters (data processing types).
Confused? You're not alone! For SAP Basis teams, sap performance monitoring of XI/PI/PO has gotten really complicated because PO has evolved into a full standalone SAP J2EE application on top of Netweaver Java AS, comprising of PI (AEX - Advanced Adapter Engine Extended) and BPM.
Application Hierarchy

Figure 1: SAP PI Dual-Stack Architecture Diagram (Courtesy of SAP SE)

Figure 2: SAP PO Single-Stack Java Architecture Diagram (Courtesy of SAP SE)
Process Orchestration PO Monitoring Complexity
Netweaver Administrator's (NWA) PIMON
Unlike CCMS for Netweaver ABAP, Netweaver Java AS has its own set of monitoring instrumentation provided by the Netweaver Administrator (NWA) web interface. SAP Java monitors many links and screens to navigate in order to check the various components, see Process Orchestration Monitoring for SAP's description on how to access monitors for PO [PI Monitoring (PIMON) - SAP PI Monitoring], and PI 7.3 Monitoring Guide for Single-Stack.

Figure 3: PIMON Home Page
Alternatively, you can connect the Java stack to SAP CCMS of an ABAP system, but that introduces additional dependencies and potential reliability problems typical of CCMS.
Solution Manager 7.2 Central PI Monitoring
If you're an SAP Solution Manager shop and want to invest resources in configuring and managing it to monitor PO, visit Central PI Monitoring for Solman 7.2.
The jury is still out on whether Solman 7.2 made it any easier to monitor and manage SAP PO. Let us know your experience.
IT-Conductor Streamlines PO Monitoring
IT-Conductor recently introduced SAP PO Monitoring in addition to SAP J2EE Infrastructure Monitoring. Unlike native SAP J2EE monitoring and Solution Manager, IT-Conductor delivers a highly functional, cloud-based, logical, and flexible way to monitor and manage SAP J2EE Infrastructure with PO and BPM add-ons, in a single service grid.
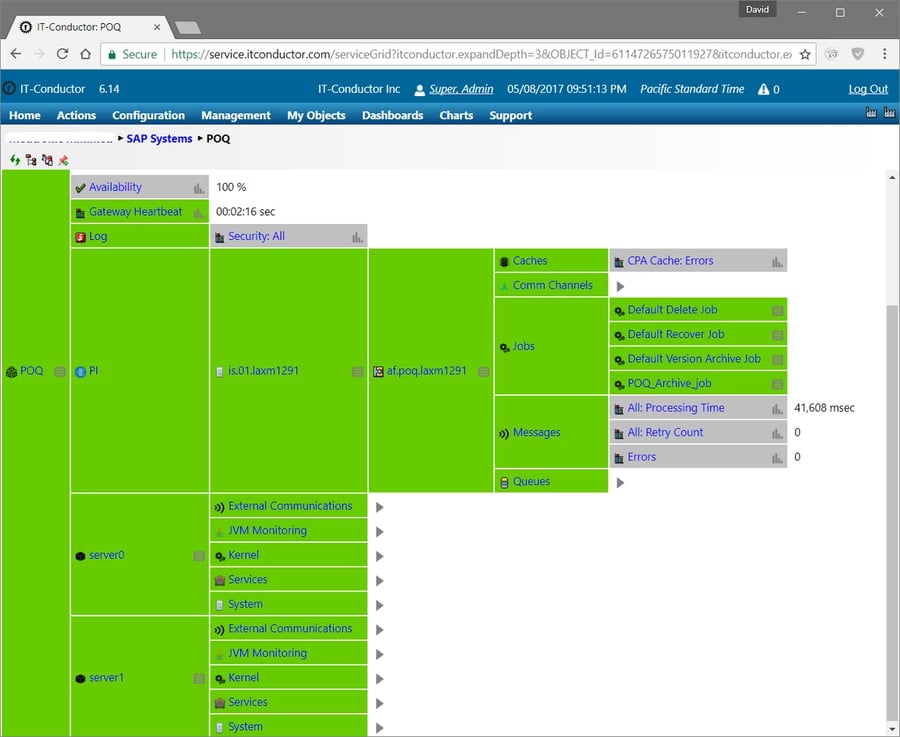
PI/PO Service Grid
Once the SAP Netweaver Java AS system has been added to SAP Java monitoring via a Wizard, IT-Conductor discovers the SAP Java Cluster Nodes then the PI components are associated including:
- Java Server Nodes
- Integration Server (AEX)
- Adapter Framework:
- Caches
- Communication Channels
- Jobs
- Messages
- Queues
The above covers status, performance metrics, and workloads that helps with Performance monitoring for the Advanced Adapter Engine alongside the SAP J2EE server.

Figure 4: PI/PO Service Grid
Time-Synchronized Troubleshooting Context
IT-Conductor introduces its standard time-synchronized context approach to this environment enabling unparalleled visibility into performance bottlenecks and making troubleshooting easy and fast.

Figure 5: Time-Synchronized Troubleshooting Context in IT-Conductor
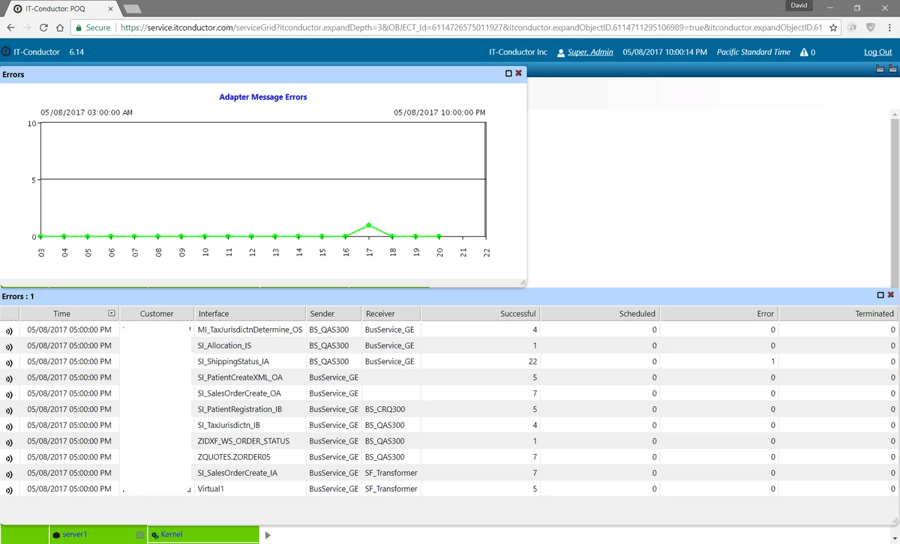
Events and Performance Together
Historical, Interval-based collectors allow you to drill down into the errors and have the whole context at your fingertips. More analysis can be done from a single console.

Figure 6: Performance Chart and Events Table in IT-Conductor
IT-Conductor - More Good Things to Come for PO Monitoring
IT-Conductor supports PI/PO Monitoring today and is already testing enhancements to include Business Process Monitoring (BPM) that you can benefit from immediately when released due to our agile cloud-based continuous innovation platform. So whether you just need SAP Java stack monitoring, PI/PO Monitoring, or any application running on SAP Java, start your journey today without cumbersome and expensive on-premise silo tools.
