UPDATE: For the latest update and webinar recording, visit Centralized SAP SLT and RFC Connection Monitoring publication.
I'm glad to be finally back from a very successful customer Go-live of an SAP ERP 4.7 to ECC 6.0 Ehp7 Near-zero Downtime (nZDM) upgrade, combined with a database upgrade and platform migration from AIX/Oracle 11g to Linux/Oracle RAC 12c over the President's Day holiday. There were plenty of sleepless nights during go-live but the client was very happy with the performance of the new system. It was good to be prepared for performance comparisons mentioned in our last blog post about Crucial Performance Tips for Upgrades & Migrations.
On average, the Batch workload ran twice as fast, and Dialog rocketed to three times the speed compared to the old system. The increased speed and capacity will allow this customer to drastically improve the way business is done in the near future, including the ability to replicate and report near real-time using a combination of ECC, BW on HANA and SAP LT Replication Server (SLT - SAP Landscape Transformation), otherwise known as a Sidecar scenario. SAP SLT is enabling customers to replicate business data across their system landscape at the database trigger level, thus allowing high-speed data synchronization between similar or disparate database platforms. For the Basis team, this is another technical scenario to monitor to ensure the availability and performance of SLT meet the business demand for near real-time information. See SAP Operations Guide for detailed information about SAP Landscape Transformation Replication Server.
Let's look at existing ways we can perform SAP LT Monitoring:
- In the SLT Server using transaction LTR (Configuration & Monitoring Dashboard) which launches a web-based SAP Netweaver Business Client. You will need to assign the role SAP_IUUC_REPL_ADMIN to your user's profile
- In the SLT Server using LT Replication Server Cockpit (LTRC) to check and monitor a single configuration at a time for transfer status, analyze errors, and manage the load and replication
- In the SLT Server using LT Replication Server Monitoring (LTRO) which is relatively new and can monitor and manage multiple configurations
- In the SLT Server using Migration Workbench (MWBMON) to monitor and analyze Mass Data Transfer
- In SAP Solution Manager 7.1 (at least SP05, and DMIS_2010 SP07 on SLT Server). SAP Note 1558756 – ‘Solution Manager 7.1. – BI Monitoring: Prerequisites’ describes the prerequisites to be met and the necessary configuration steps in order to integrate the SAP LT Replication Server Monitoring Information into the SAP Solution Manager E2E Alerting Infrastructure.
See more details below, but unsatisfied with the set of manual methods above, we started to develop our own SLT Monitoring solution add-on to the SAP Management Pack for Microsoft SCOM, capable of monitoring the health, availability, and performance of SLT configurations down to each table level.
Monitoring on the SLT Server
Options 1-3 above, you can follow the SCN blog on Basic Troubleshooting Activities for SAP LT Replication Server Monitoring.
Let's review each in a little more detail with some screen samples from a demo system we set up for a basis Netweaver 7.4 system replicating to a HANA system:
LTR (Configuration & Monitoring Dashboard)
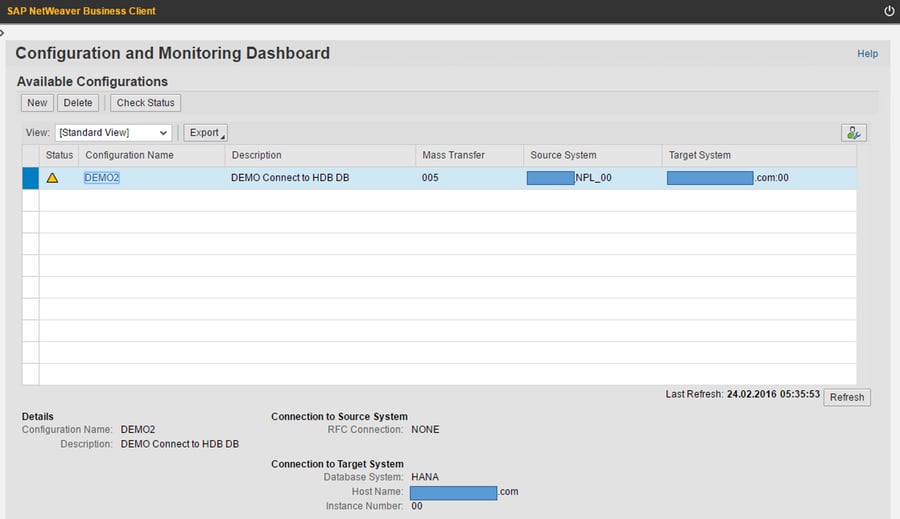
Figure 1a: SAP Netweaver Business Client (Configuration and Monitoring Dashboard)
On the SAP Netweaver Business Client, you can:
- Jobs and Connections: Check the status of jobs (batch processes available and utilized) and connections (RFC & DB connections)
Figure 1b: SAP Netweaver Business Client (Jobs and Connections)
- Triggers: tables configured to replicate have DB triggers created on the source system to record changes in SLT logging tables
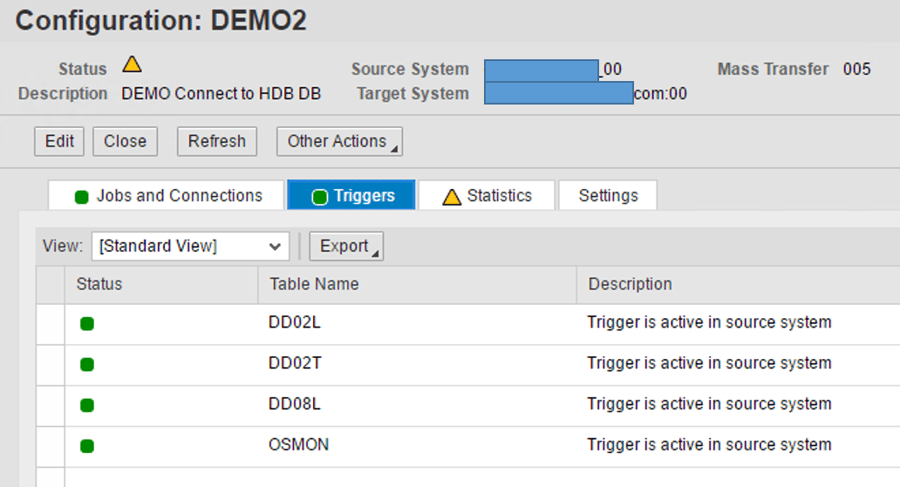
Figure 1c: SAP Netweaver Business Client (Triggers)
- Statistics: Replication details (Insert, Update, Delete), and latency (in seconds over the last 24 hours)

Figure 1d: SAP Netweaver Business Client (Statistics)
- Settings: Configure data transfer job options as well as replication schedule
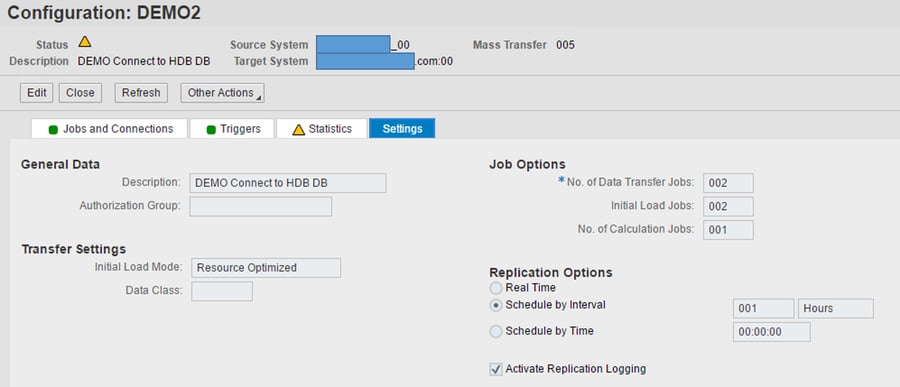
Figure 1e: SAP Netweaver Business Client (Settings)
Note: By default, the system summarizes statistical data based on hours, days, and retention. Although the status can change from GREEN to YELLOW to RED, alerts are not sent via notification anywhere. You have to be logged on to the dashboard and manually click refresh to see status changes, and if you're not refreshing often, your session will get timed out, so it's really inconvenient!
LTRC & LTRO (LT Replication Server Cockpit / Monitoring)
LTRO on the SAPGUI Client you can monitor:
- The number of currently running and free batch and dialog processes running on all application servers of the SAP LT Replication Server system.
- The availability status for all connected target systems, and the corresponding log entries (warnings and errors)
- The status of multiple configurations (mass transfer IDs) within a single screen
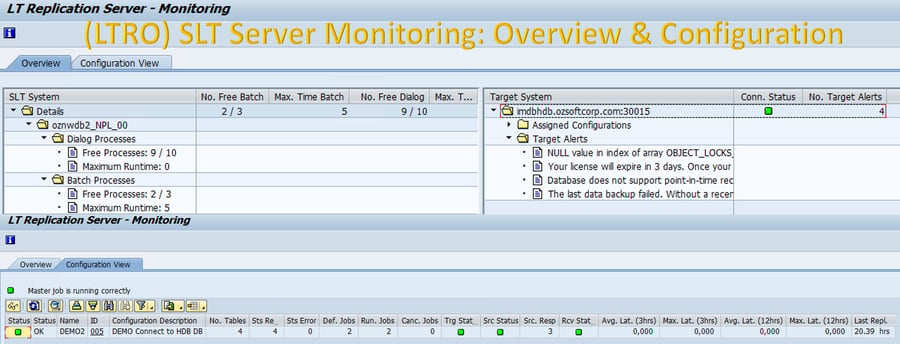
Figure 2: LT Replication Server Monitoring (Overview and Configuration)
LTRC existed before LTRO and was developed to view one configuration at a time so it's more cumbersome if you are managing multiple configurations. LTRO is simpler for global monitoring of the SLT server, while LTRC provides the administrator a guided view into the configuration as well as data transfer monitoring & statistics.
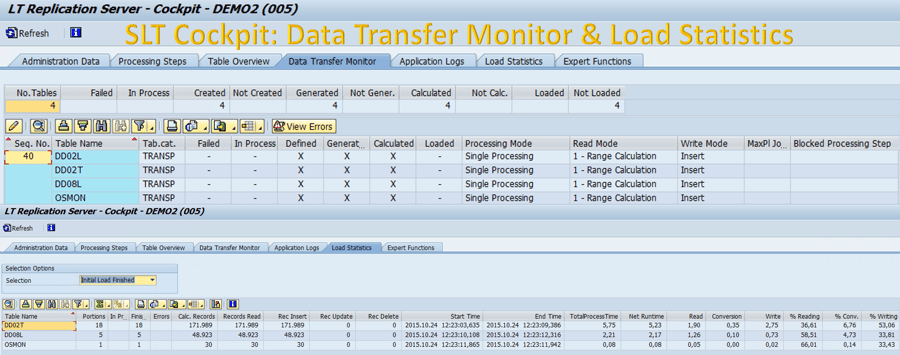
Figure 3a: SLT Cockpit (Data Transfer Monitor and Load Statistics)
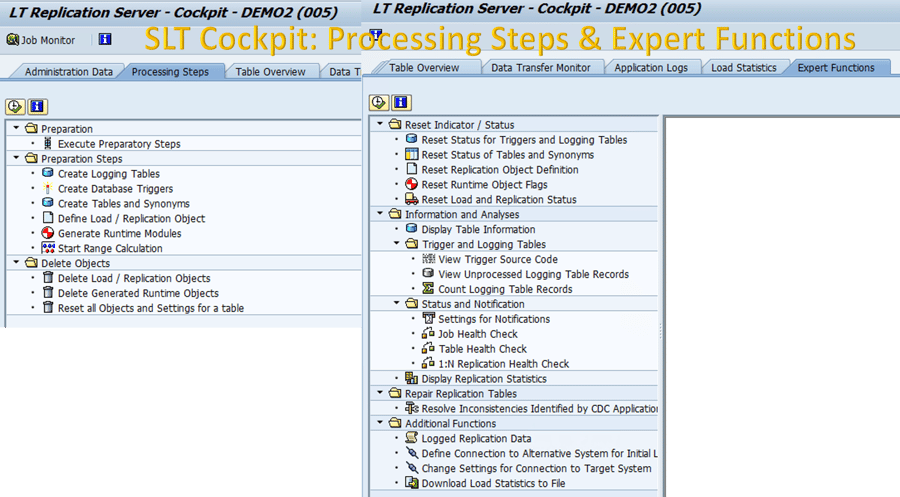
Figure 3b: SLT Cockpit (Processing Steps and Expert Functions)
MWBMON (Migration Workbench Monitor for Mass Data Transfer)
MWBMON on the SAPGUI Client you can monitor:
- Similar to LTRC, but with Mass Data Transfer and in-depth performance analysis for tables, indexes, space, and even host resource utilization (System Monitor, Expert Functions > System Functions)
- Activities Log
- Expert Functions: Migration Workbench activities such as Reset of Processing Steps, Table mapping, and Performance Analysis
There seems to be some overlap between this and LTRC, perhaps they should really merge into a single transaction.
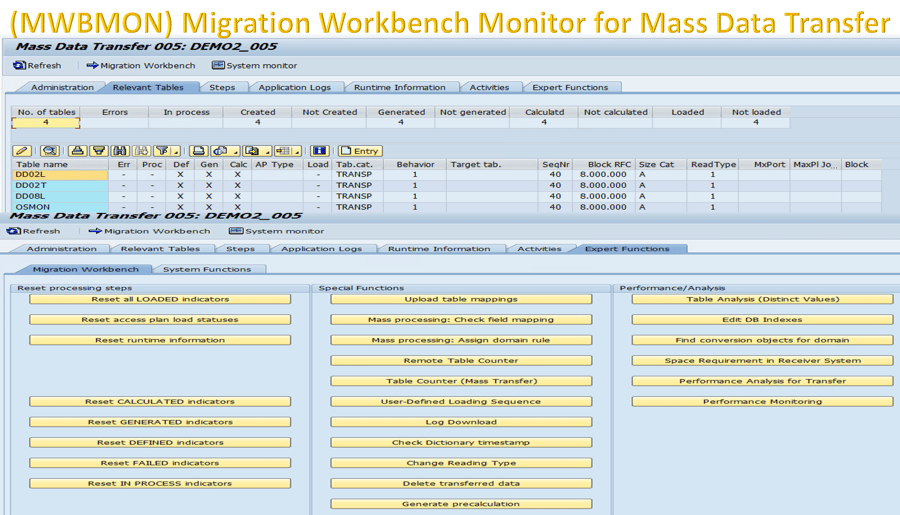
Figure 4: Migration Workbench Monitor for Mass Data Transfer
Setup & Monitoring using Solution Manager
Setup instructions and examples can be found on the SCN blog SAP SLT Monitoring with Solution Manager 7.1 so I won't get into the details. But, I will say it took us a few days to configure and troubleshoot the setup, install and update all kinds of plugins and support packs, activate BI objects, and yet we still don't get any status or performance data in Solution Manager. See sample screenshots below where statuses are blank. Therefore, I'm not impressed with this monitoring setup and functionality, particularly since it only gains monitoring of aggregated data.
Note: Per SAP: The system monitoring capabilities of SAP Solution Manager do not allow the viewing of details for each table and related trigger – it contains only aggregated information for a schema, such as job, trigger, and table status. This remains the theme of Solution Manager where most data is aggregated but provides only a big picture, however, you still would need to log on to the managed system to look for more detail.
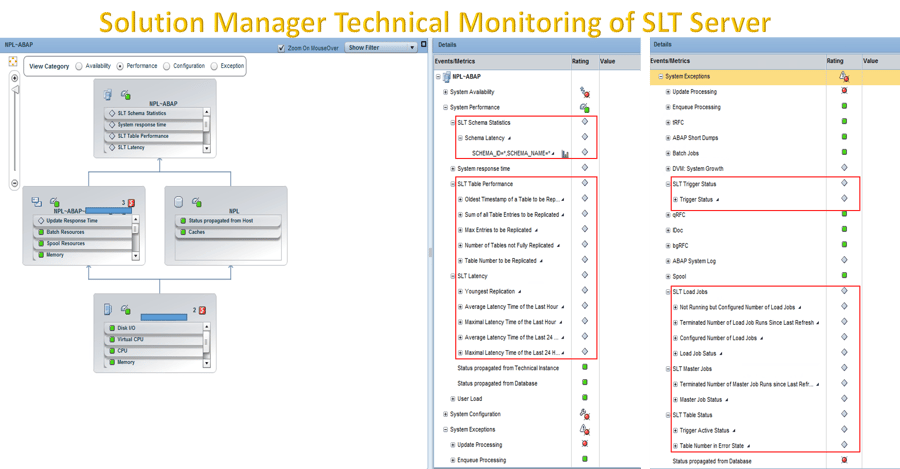
Figure 5: Solution Manager Technical Monitoring of SLT Server
3rd-Party SLT Monitoring
Our first support of the SLT monitoring add-on management pack for SAP MP for SCOM will provide the availability and performance of each table in each SLT configuration, allowing independent threshold settings for alerts outside of the SLT Server. This release in March will be included FREE for our SAP MP customers. As we continue to add features to SLT Monitoring, we will also support it via our cloud-based IT-Conductor solution where you can build service-level monitors for SLT.
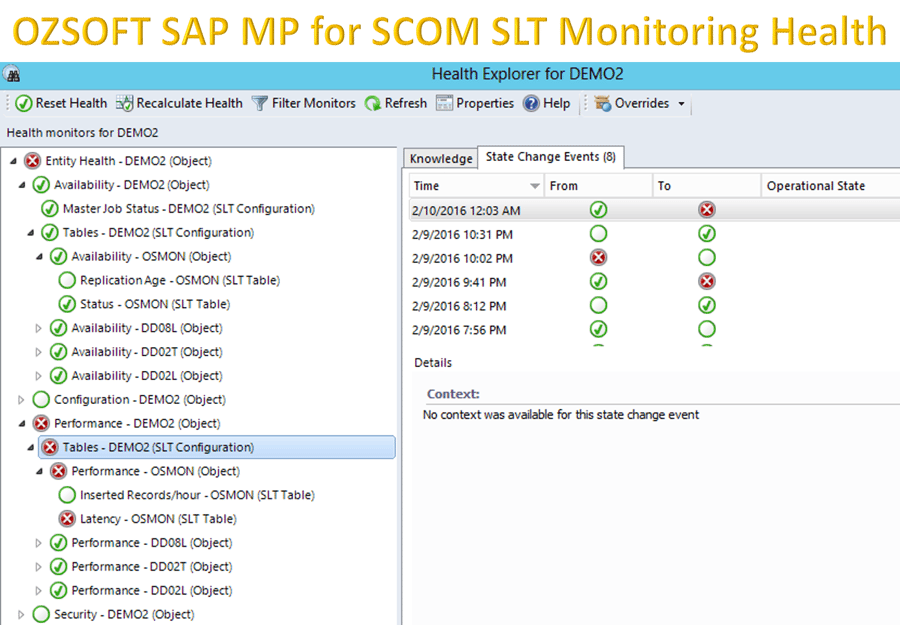
Figure 6: OZSoft SAP MP for SCOM SLT Monitoring Health
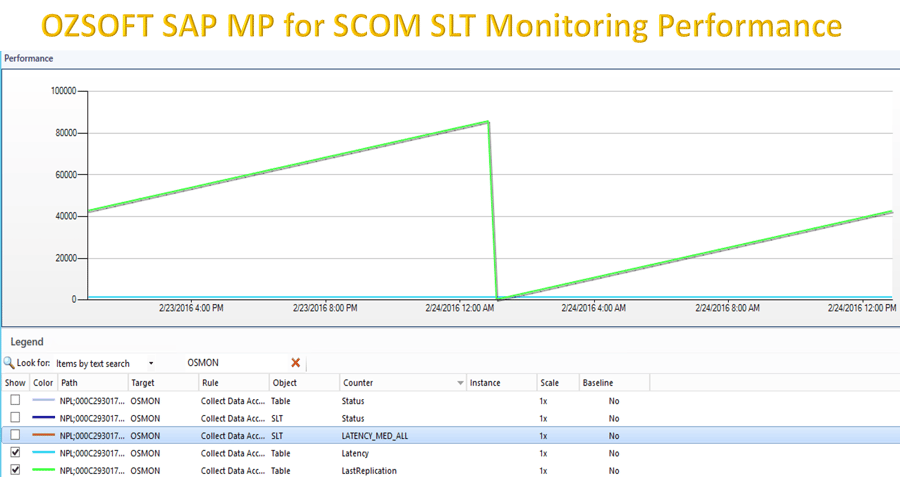
Figure 7: OZSoft SAP MP for SCOM SLT Monitoring Performance
With HANA Live and Sidecar apps on the rise, real-time or automated replication of business data across your system landscape would likely depend on SAP LT Replication Server, similar to SAP PI which has been used widely as messaging broker between SAP systems. But monitoring SLT is currently a very manual or unreliable process. More work needs to be done to closely monitor the health, runtime availability, and performance of table replication. We're progressing toward an automated SLT monitoring solution for both on-premise as well as cloud-based performance management. Let us know your challenges and interests in such solutions.
Want to monitor your systems before and after the upgrade and compare performance baselines down to the transaction level all from the cloud? Subscribe to our cloud-based IT-Conductor. With a few clicks and a few minutes, you can monitor and alert your SAP systems. Truly SAP Performance management without the hassles!
