Designed to orchestrate complex IT operations, the IT-Conductor platform can easily make sense of all the components in your entire SAP system landscape. Its monitoring framework is built upon the concept of creating thresholds and overrides for each metric that you need to monitor.
In managing SAP systems, it’s easy to fall into the trap of including a lot of metrics which are hard to make sense of. Configuring thresholds and overrides allows you to manage them and only show what is meaningful to you—effectively minimizing noise. Once the noise is minimized, the focus can shift to automated recovery actions to maximize performance by policy-based actions to recover from errors such as job and queue failures, therefore efficiently improving service resiliency.
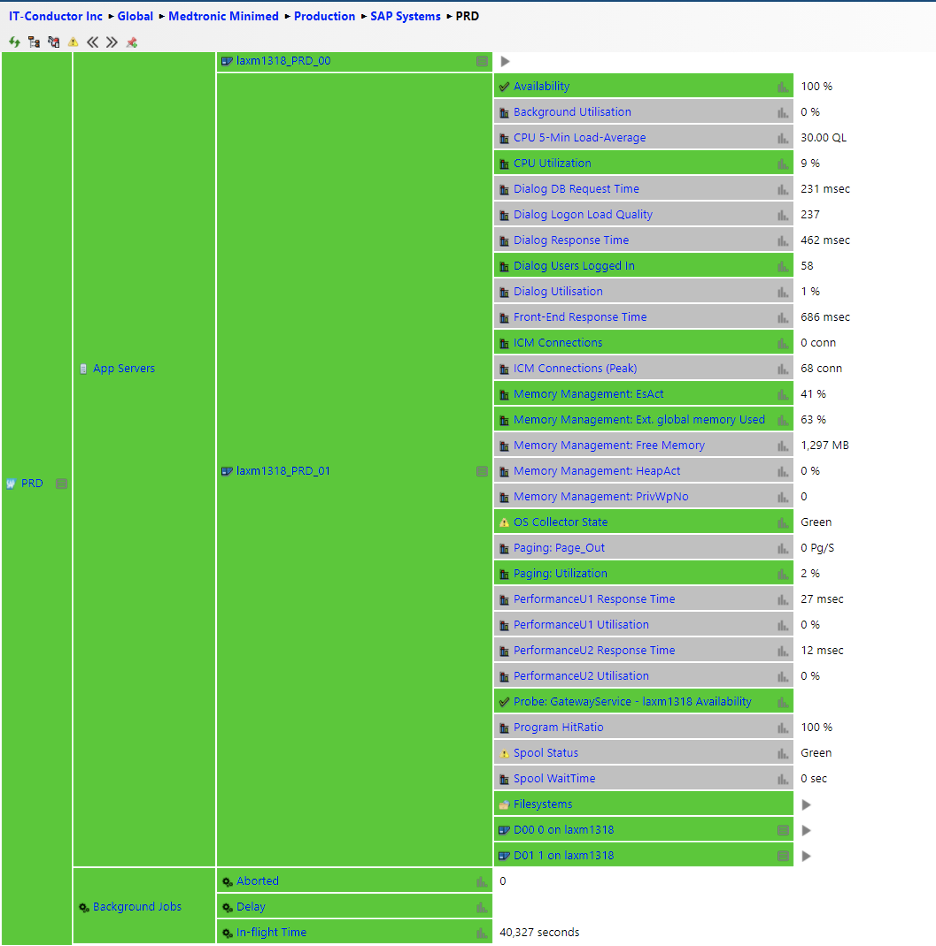
Figure 1.1: Sample Expanded Service Grid
In Figure 1.1, you can see how a monitored system can be drilled down further up until the metrics are shown (i.e. Availability, CPU Utilization, etc.) with their appropriate color-coded status.
Beside the metric are the actual values captured by the platform. Notice that there are still values even if a metric is not monitored. This simply means that at this stage of monitoring, you can already benefit from minimizing the alerts and notifications you receive, but at the same time, you can easily configure a metric whenever you need them.
Monitoring SAP covers availability monitoring, alerts management, performance management, and reporting.
Monitoring availability in IT-Conductor is straightforward. Once a component is registered and configured for monitoring, the tool automatically detects its status.
In Figure 1.1, you can see at a glance if a particular component is available or unavailable. You can also see the severity status of each of the components in your environment. This allows administrators to have a high-level view of what systems need attention and recovery actions to revive good system health.
Most monitoring solutions treat alerts as events without much context or relationship. IT-conductor manages alerts more effectively by using policy-based exceptions where alerts can be filtered, time-synchronized, and automatically recovered, including targeted notification to the right analyst reducing mean time to repair (MTTR).
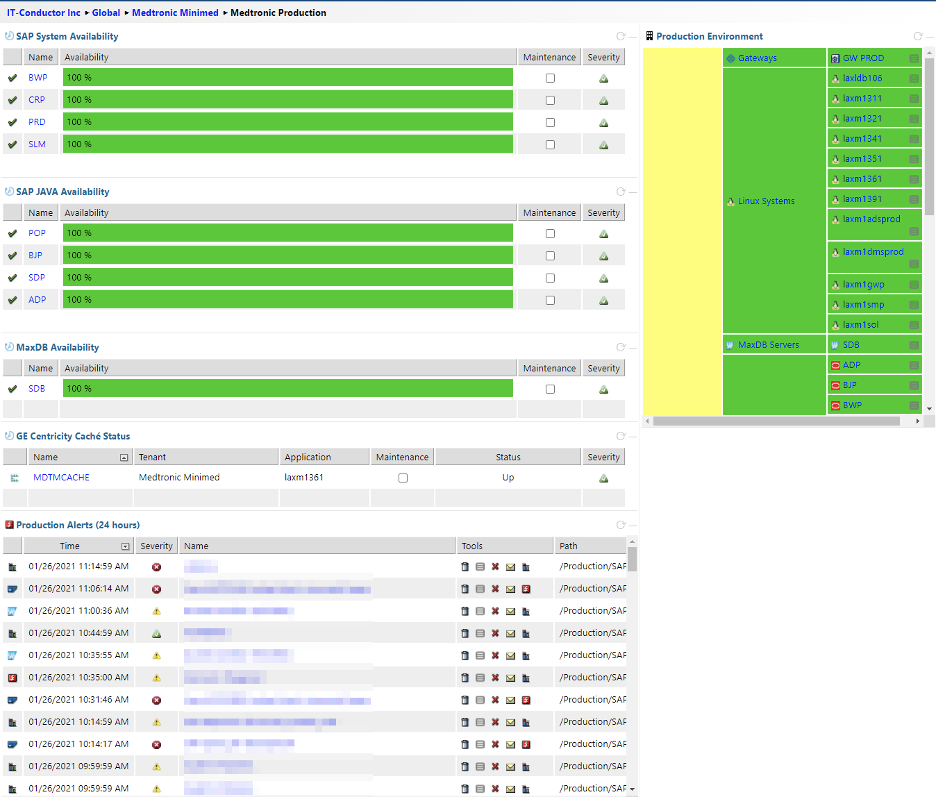
Figure 2.1: Medtronic Production Dashboard
Monitoring availability information alone is ineffectual without fully knowing its relationship with your service level objectives. By configuring the threshold and overrides, Medtronic Diabetes was able to customize the alerts and notifications according to the defined SLA and KPIs by the business.
Performance management in IT-Conductor involves easier comparisons between periods—whether per minute, hourly, daily, weekly, monthly, quarterly, or annually— all in a graphical format.
The IT-Conductor Dashboard offers a highly flexible SAP Service Level reporting that can be sent straight to a list of recipients. This allows reports to be sent automatically versus manually checking the customized dashboard. Either way, performing health checks is significantly easier using the platform versus manually logging in to your systems.
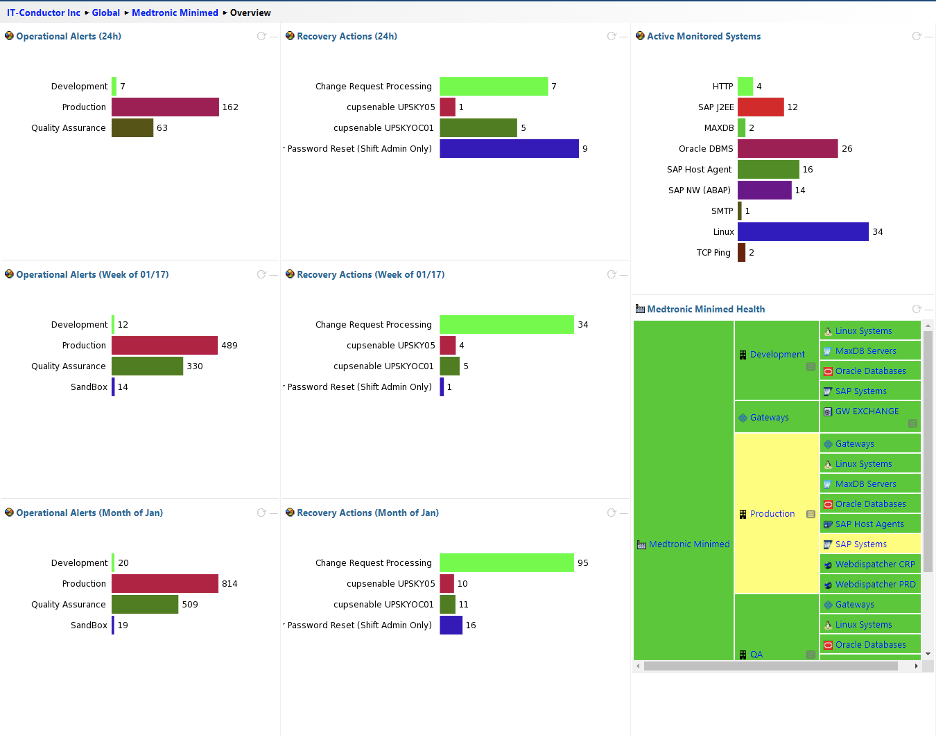
Figure 2.2 Medtronic Overview Dashboard
IT-Conductor was able to automate 70% of the change management process by using transport automation to coordinate efforts of all stakeholders within a project. The manual process Medtronic previously used was time-consuming and decentralized: SAP experts were importing requests one by one, sending messages, waiting for successful imports, and checking transport logs. Now the entire approval workflow is automated and stakeholders are sent notifications when requests or imports are complete. IT-Conductor adapted the transport automation feature to suit Medtronic's processes to ensure synchronization and compatibility while reducing risks in performing mission-critical operations.
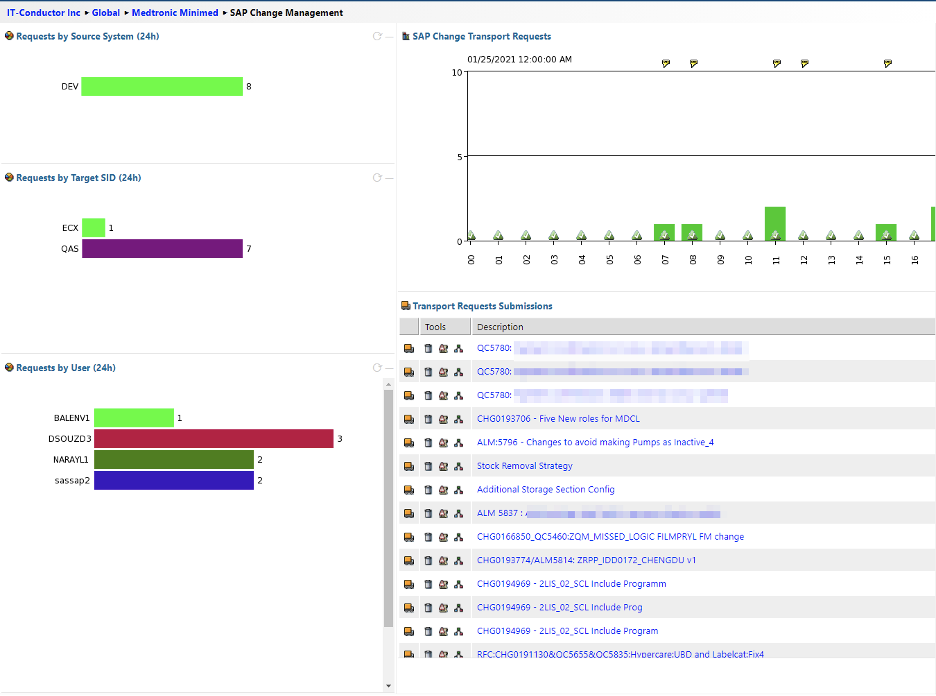
Figure 3.1 SAP Change Management
IT-Conductor SID-Refresh™ helped simplify and automate the quarterly system refresh that is required by SAP with reduced downtime. Medtronic needed a tool to refresh technical data and configuration on QA systems for ECC, CRM, and BW systems. It was using admins to manually take snapshots of the configuration to recreate environments, which was very labor-intensive and error-prone, leading to less frequent refreshes that had a more dramatic impact on the project teams.
With SID-Refresh, the Post-copy Automation is used to restore all the technical configuration effortlessly, which also includes other automation features that Medtronic found helpful:
The selected options were saved on initial use and could be reused on subsequent executions of the refresh, in scripted unattended mode.
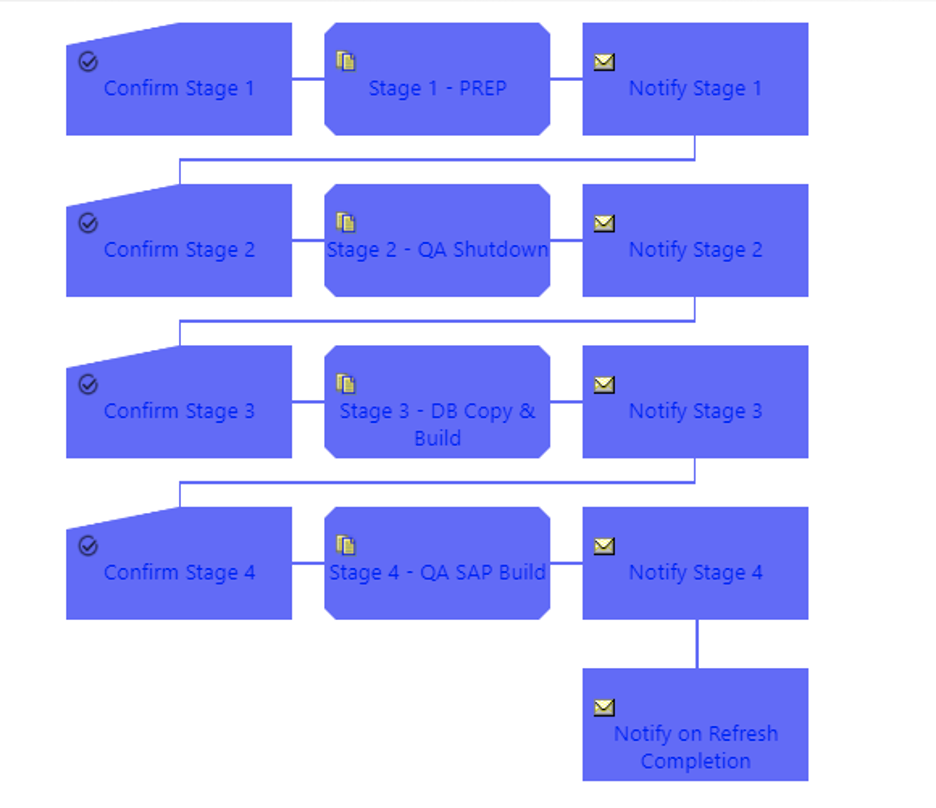
Figure 3.2 Automated Process for Running SID-Refresh in IT-Conductor
Copyright © 2025. IT-Conductor. All Rights Reserved | Privacy Policy | Terms of Use | Copyright and Trademark | Cookie Policy
