Coats Group PLC has been helping to connect and form the fabric of daily life on our planet for over 250 years as a leader in textile manufacturing technology. It is a fact that more than 90% of the world’s wearable fabric contains threads that have passed through Coats textile machines. Coats is an innovative and trusted value-adding partner, providing critical supply chain components and services to the $1.8tn (pre-Covid) global apparel and footwear industry. The company has more than 19,000 employees across 60 countries and its enterprise systems run on SAP across a large HANA landscape.
Coats operate a critical just-in-time global supply chain that processes customer orders, with on-demand production planning of input materials, textile manufacturing, and delivery promise to customers. Each end-to-end process depends on workflows that cross between ERP systems to the Supply Chain Management (SCM) system. These depend on asynchronous jobs and queues which must be processed in a timely manner in order to meet production planning needs for thousands of daily orders worldwide. Any breaks in these processes which go unnoticed and quickly fixed would result in delays downstream that could potentially disrupt the plant floors, as well as many customer and partner operations.
The sheer volume of critical jobs and queue objects that flow through the SCM system requires constant monitoring and timely error handling usually managed by a large team. Prior to the IT-Conductor solution being implemented, the SCM operations team needed 24x7 coverage with at least 10 personnel to manually perform the tasks below:
Coats migrated SAP to Azure, running on HANA in the 2017-2018 timeframe as part of its cloud and digital transformation journey. IT-Conductor was chosen as the cloud-native monitoring and automation tool to enhance the observability of the SCM process.
Coats were experiencing performance bottlenecks on its SCM system and disruptions in queue message processing (SAP qRFC), especially with many inbound queues from multiple ERP systems. As a result, Coats looked to IT-Conductor for an intelligent way to actively monitor the critical jobs against key service levels, track the age and status of inbound queues, and automate their restart to resolve most related issues.
Implementing the monitoring tool was fast and easy, and it had immediate results. Within a few hours, IT-Conductor monitored critical jobs and queues with precise root-cause analysis (RCA) observability.
Performance Intelligence and Policy-based Automation with the patented agentless IT-Conductor platform links all the components in the entire SAP system, discovering applications, databases, and underlying virtualized infrastructure allowing relating issues to be resolved much faster.
Both the standard and custom dashboards provide a single pane of glass for the global health of the critical business system at a glance while allowing context-sensitive drill-down for further details and one-click RCA. This approach minimizes the noise and focuses only high priority exceptions which can potentially impact SLAs. These exceptions are automatically addressed by recovery actions to maximize performance and availability, for example, to recover from errors such as job and queue failures, therefore efficiently improving service resiliency.
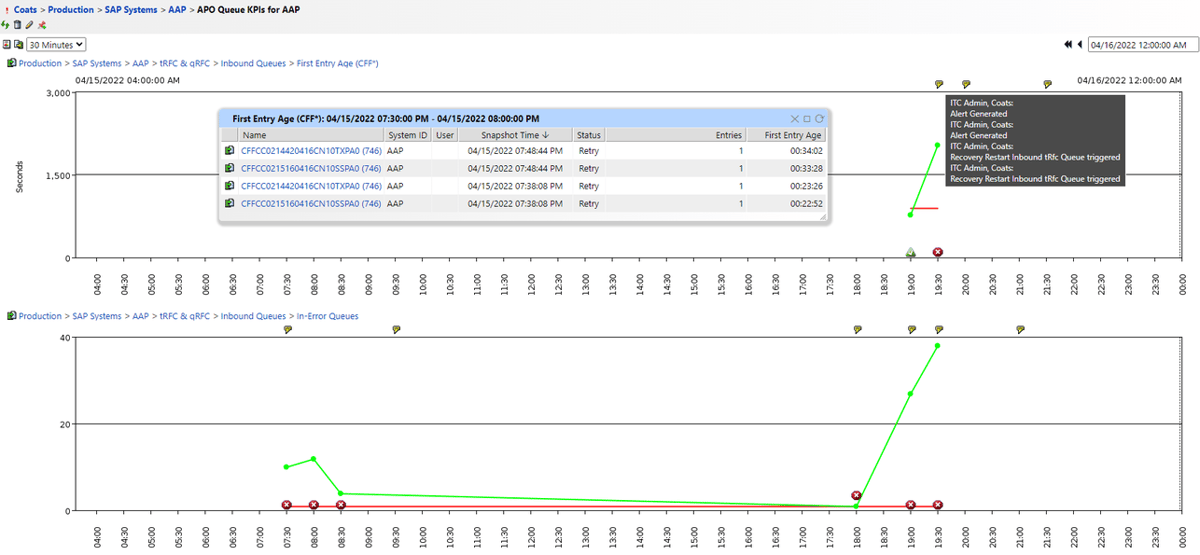
Figure 1.1 Queue Age and Error Detection with Auto-recovery
In Figure 1.1, Queue Age and Error Detection with Auto-recovery Dashboard - the state and age of each SAP qRFC message are monitored with precision and thresholds to trigger auto queue restart upon error detection, or if the message is stuck beyond a specific age. This approach auto-manages thousands of queues with their individual metrics per hour, significantly beyond what any human could potentially do.
Performance Intelligence and Policy-based Automation with the patented agentless IT-Conductor platform links all the components in the entire SAP system, discovering applications, databases, and underlying virtualized infrastructure allowing relating issues to be resolved much faster.
Both the standard and custom dashboards provide a single pane of glass for the global health of the critical business system at a glance while allowing context-sensitive drill-down for further details and one-click RCA. This approach minimizes the noise and focuses only high priority exceptions which can potentially impact SLAs. These exceptions are automatically addressed by recovery actions to maximize performance and availability, for example, to recover from errors such as job and queue failures, therefore efficiently improving service resiliency.
Figure 1: Queue Age and Error Detection with Auto-recovery
In Figure 1, Queue Age and Error Detection with Auto-recovery Dashboard - the state and age of each SAP qRFC message are monitored with precision and thresholds to trigger auto queue restart upon error detection, or if the message is stuck beyond a specific age. This approach auto-manages thousands of queues with their metrics per hour, significantly beyond what any human could potentially do.
Monitoring SAP covers availability monitoring, alerts management, performance management, and reporting.
Availability Monitoring
Monitoring availability in IT-Conductor is straightforward. Once a component is registered and configured for monitoring, the tool automatically detects its status.
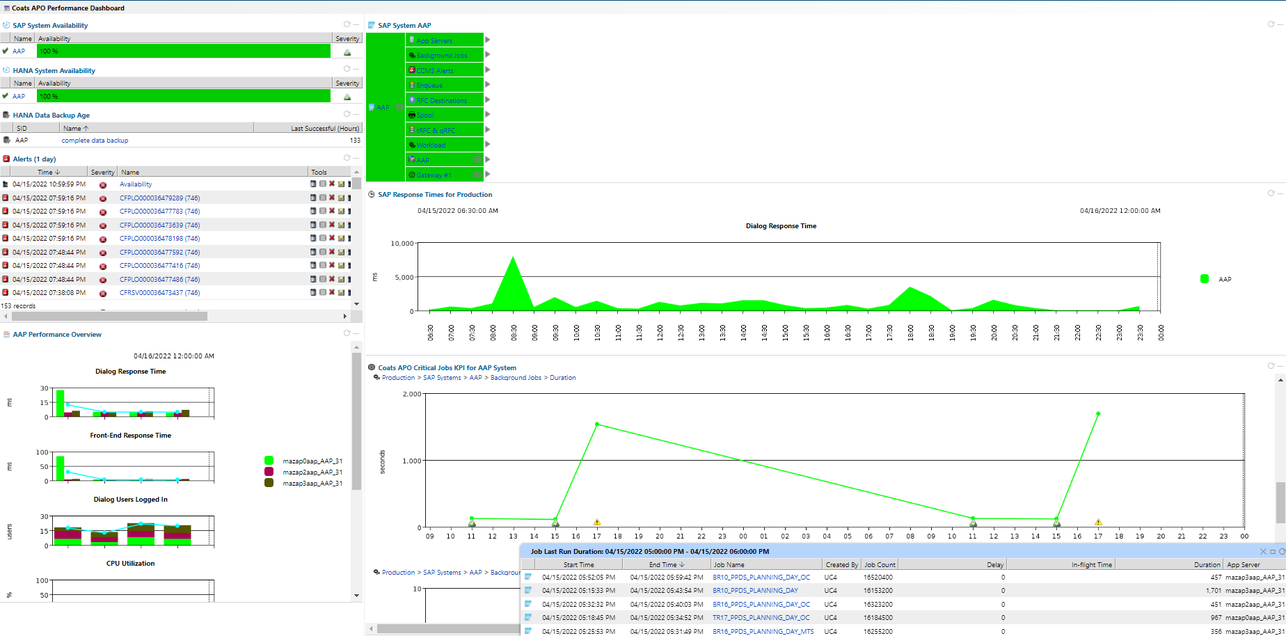
In Figure 2, for the Coats SCM (APO) Performance Dashboard, you can see at a glance all system component availability by color and percentage. You can also see the severity status of each of the components in your environment. This allows administrators to have a high-level view of what systems need attention and recovery actions to maintain good system health.
Performance Management
Monitoring availability information alone is ineffectual without fully knowing its relationship with your service level objectives. By configuring the threshold and overrides, Coats was able to customize the alerts and notifications according to the defined SLA and KPIs by the business, entire system performance overview to end-user response times and critical job inflight runtimes, customizable to specific jobs.
Performance management in IT-Conductor involves easier comparisons between periods—whether per minute, hourly, daily, weekly, monthly, quarterly, or annually— all in a graphical format.
Alerts Management
Most monitoring solutions treat alerts as events without much context or relationship. IT-Conductor manages alerts more effectively by using policy-based exceptions where alerts can be filtered, time-synchronized, and automatically recovered, including targeted notification to the right analyst reducing the mean time to repair (MTTR).
Reporting
The IT-Conductor Dashboard offers a highly flexible SAP Service Level reporting that can be sent straight to a list of recipients. This allows reports to be sent automatically versus manually checking the customized dashboard. Either way, performing health checks is significantly easier using the platform versus manually logging in to your systems.
In Figure 3.1, Coats Health SLA, Alerting and Automation Overview Dashboard highlights the health status with drill-down capability, alerts in the last 24 hours/current week, along the recovery actions taken. Clicking on each bar would list the actual time and recoveries automated.
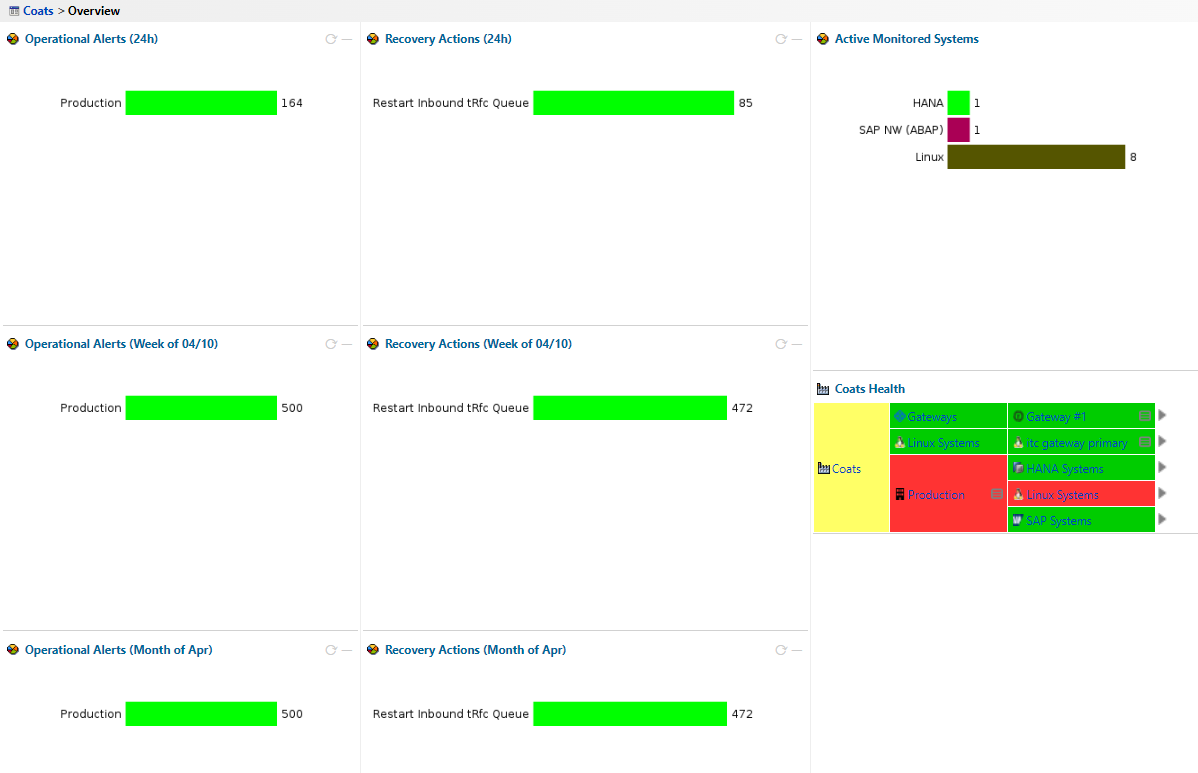
Figure 3: Coats Health SLA, Alerting and Automation Overview Dashboard
E-mail us at info@itconductor.com
Phone Support
Worldwide: +1 (408) 416-2565
North America Toll-free: +1 (888) 553-5256
Monday to Friday 8:00 am to 7:00 pm US Pacific Time
Copyright © 2025. IT-Conductor. All Rights Reserved | Privacy Policy | Terms of Use | Copyright and Trademark | Cookie Policy