Ten Ways to Smart Application Performance Management
1. 360-degree view of Application Environment
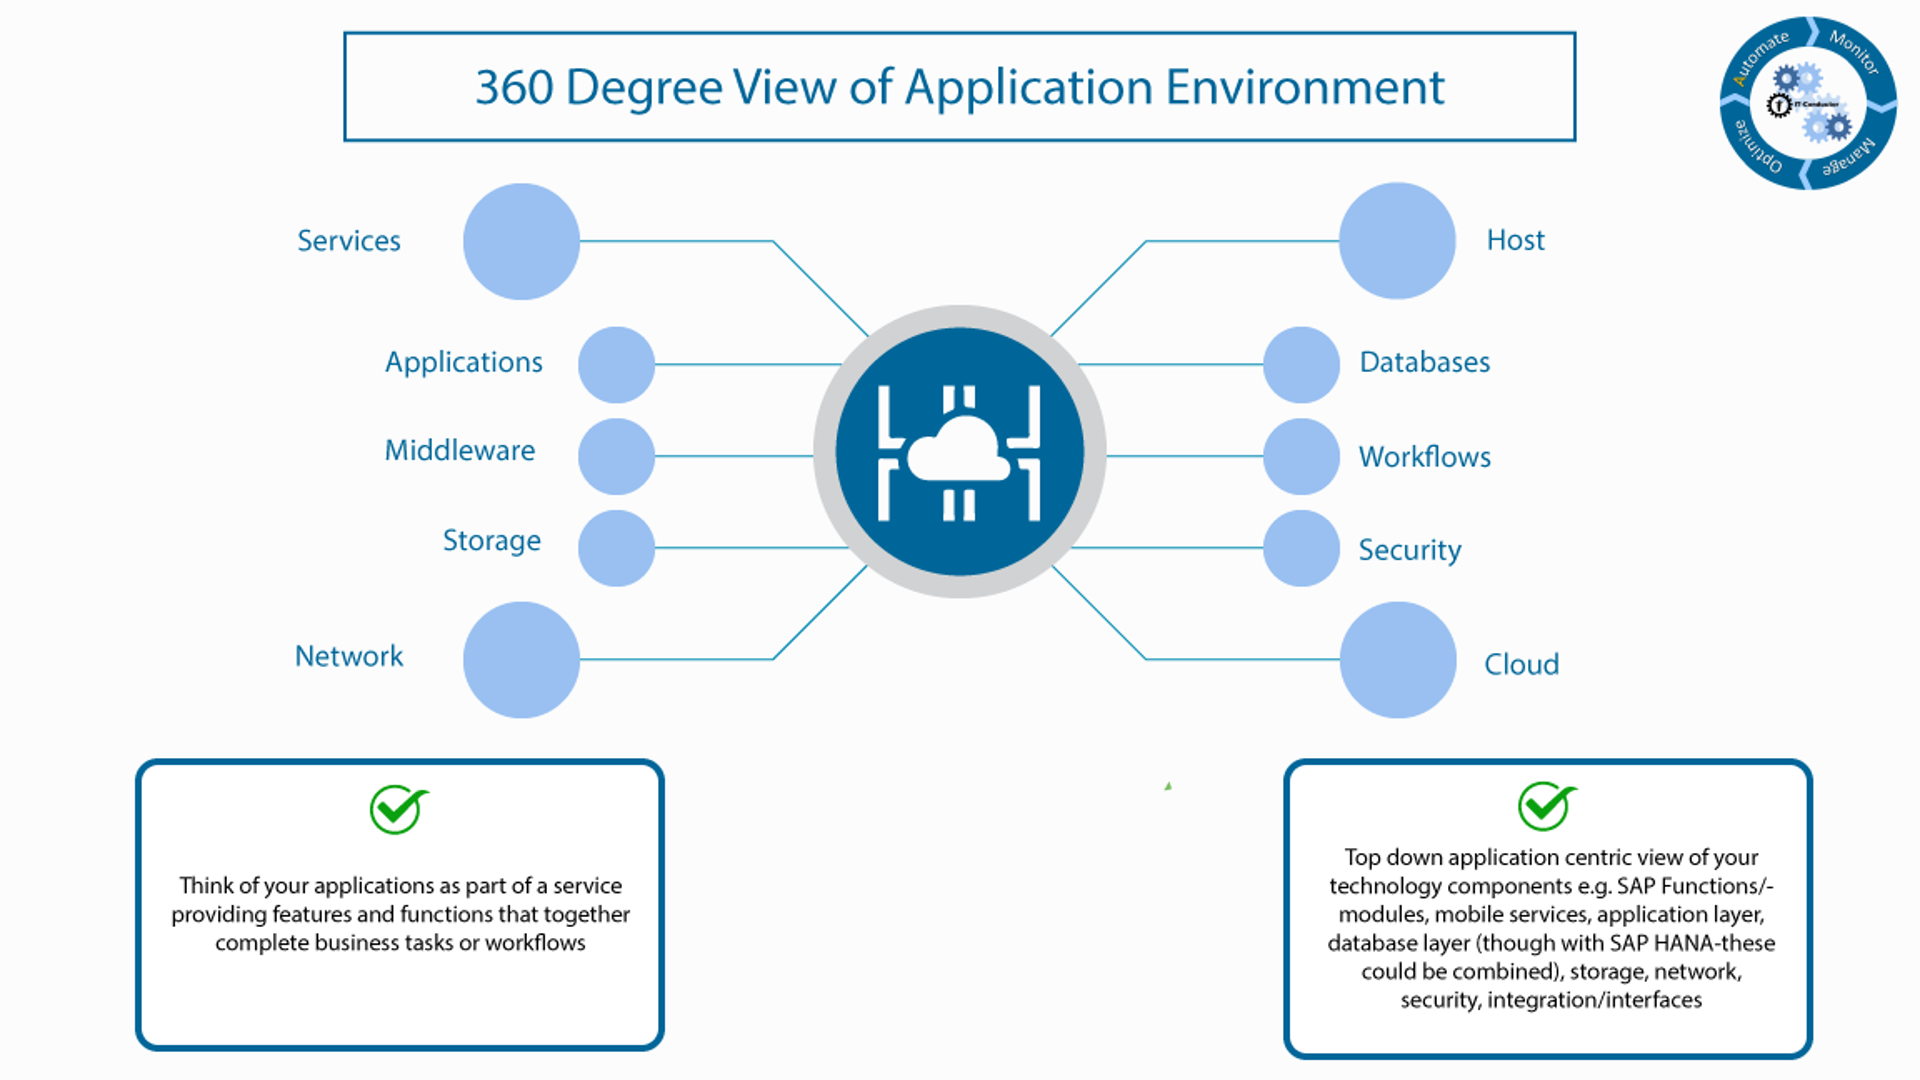
Think of your applications as part of a service providing features and functions that together complete business tasks or workflows.
Top down application-centric view of your technology components that make up the services, e.g. SAP Functions/modules, mobile services, application layer, database layer (through with SAP HANA - these could be combined), storage, network, security, integration/interfaces.
2. Availability and Performance Monitoring
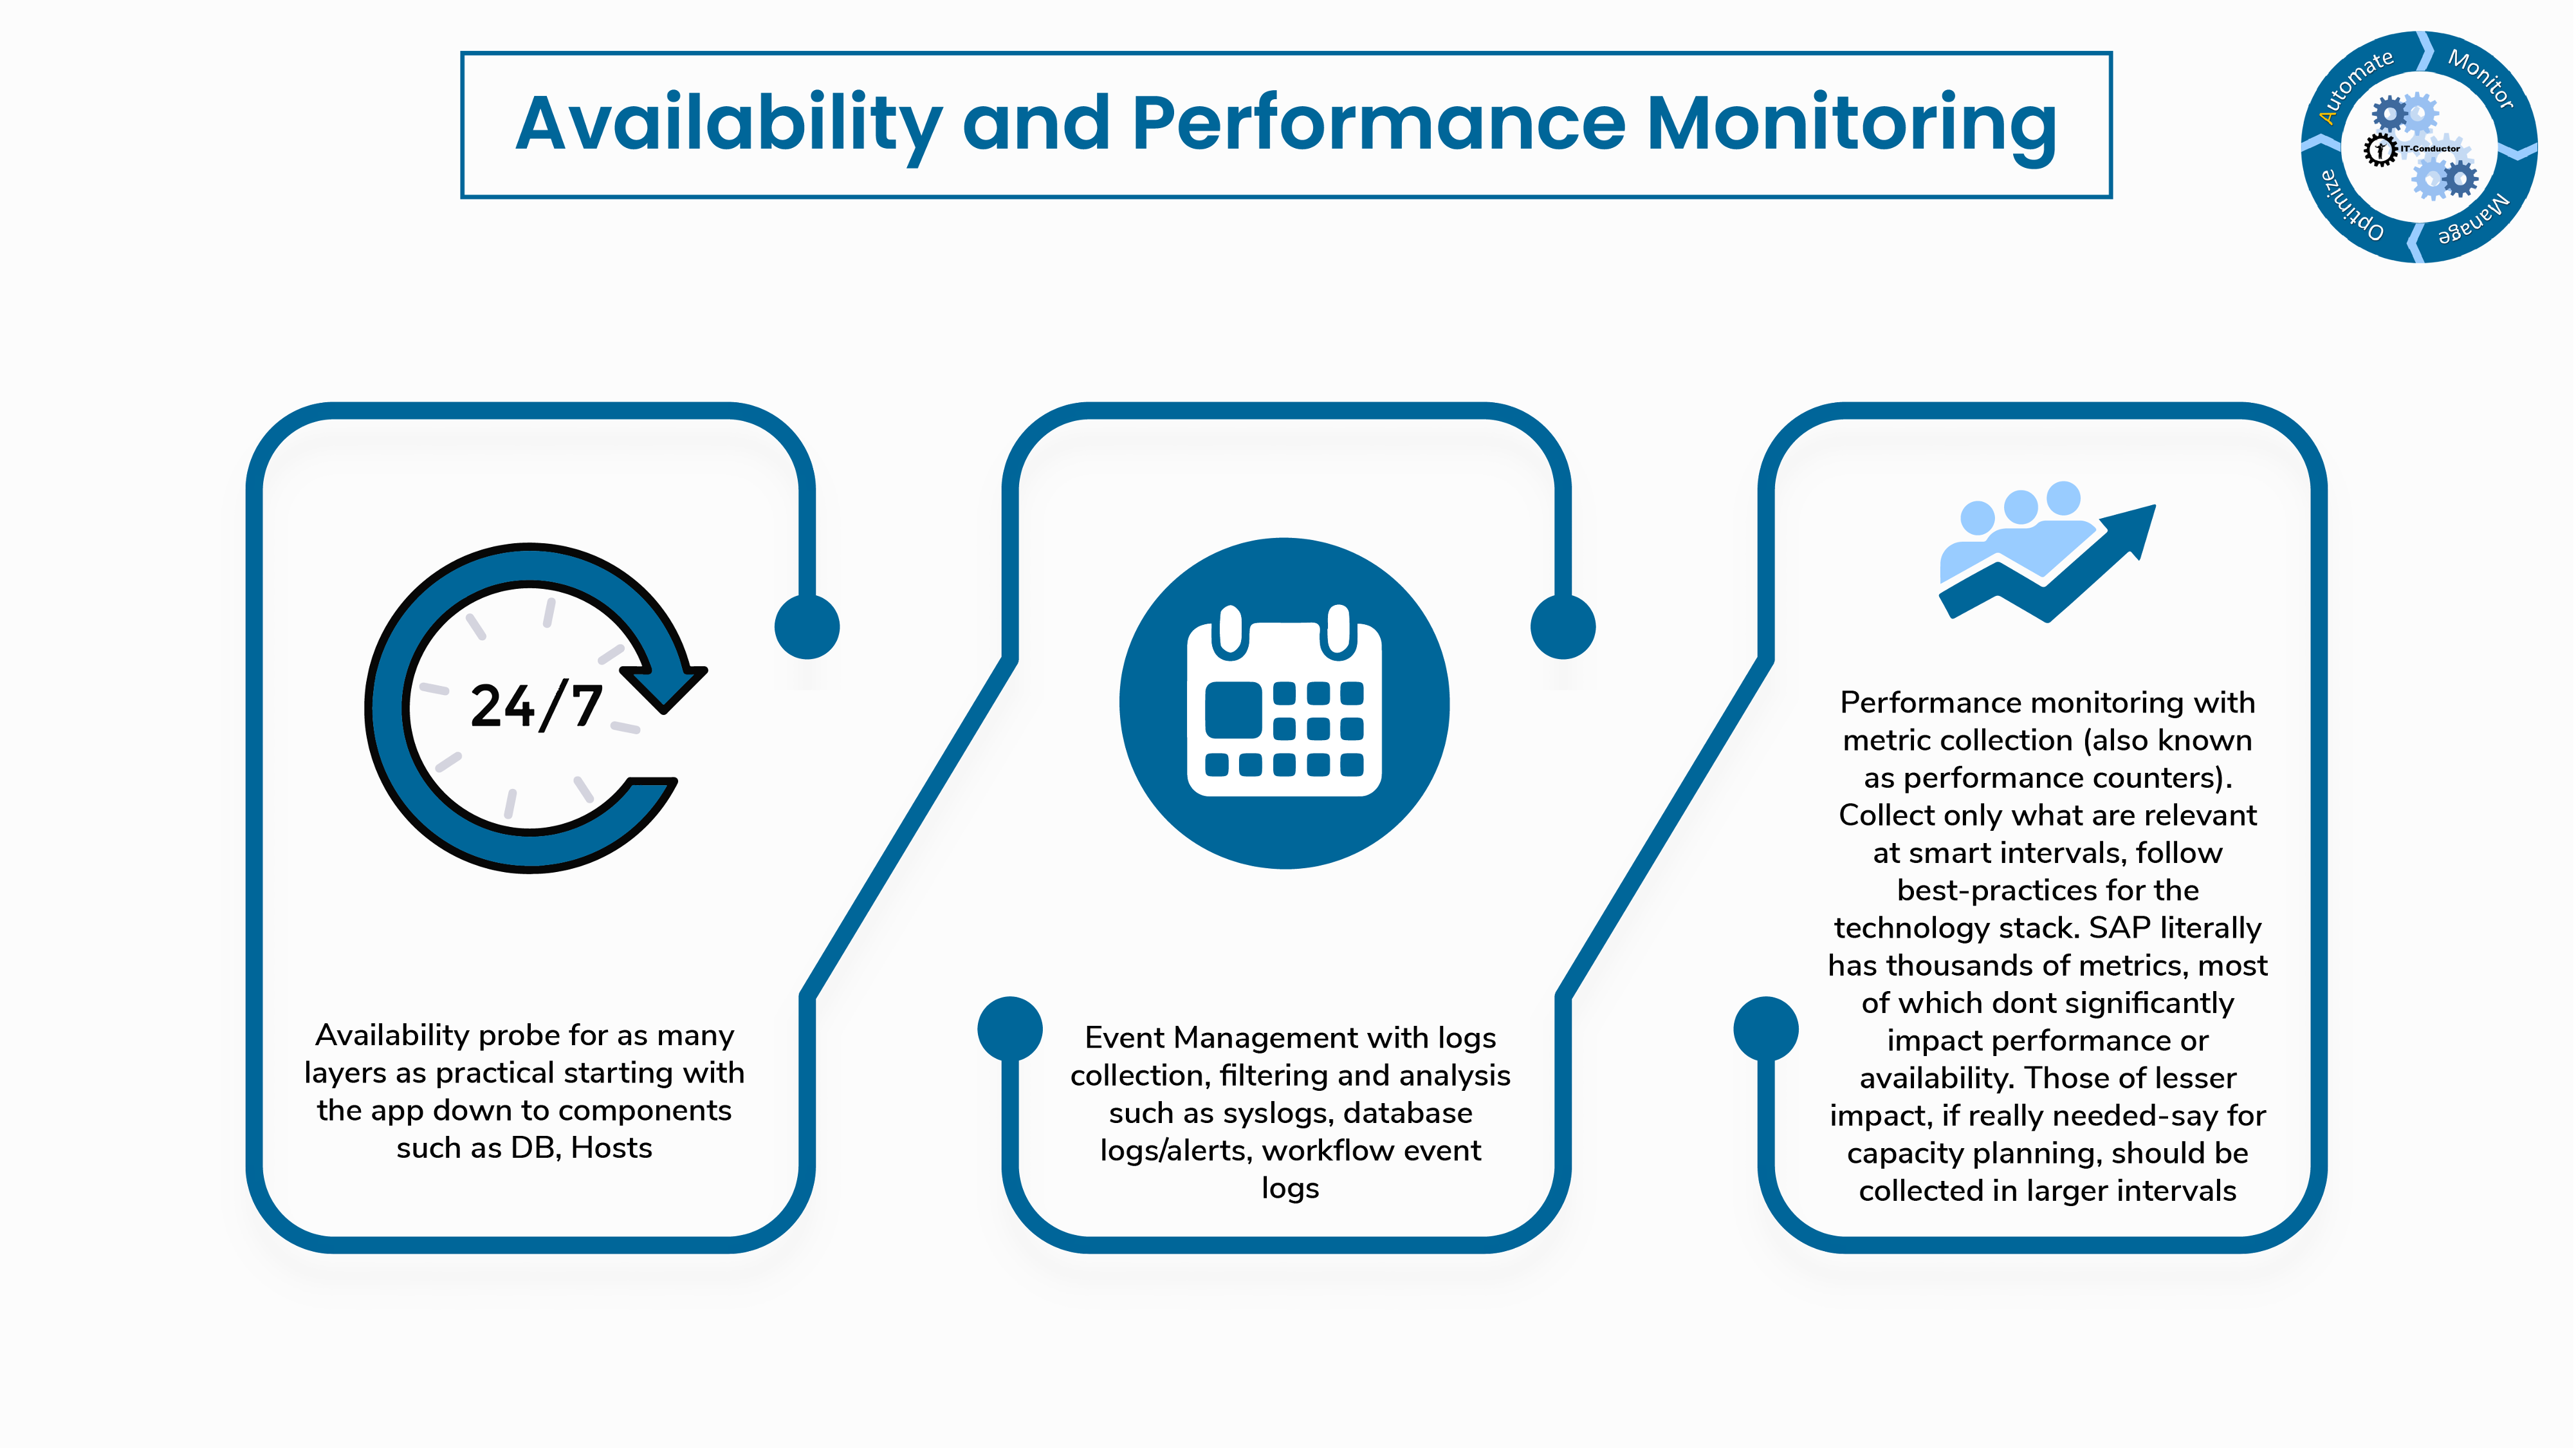
Availability probe for as many layers as practical starting with the app down to components such as DB, Hosts.
Event management with logs collection, filtering and analysis such as syslogs, database logs/alerts, workflow event logs.
Performance monitoring with metric collection (also known as performance counters). Collect only what are relevant at smart intervals, follow best-practices for the technology stack. App can have up to thousands of metrics, most of which don't significantly impact performance or availability. Those of lesser impact, if really needed - say for capacity planning, should be collected in larger intervals.
3. Root-cause Analysis
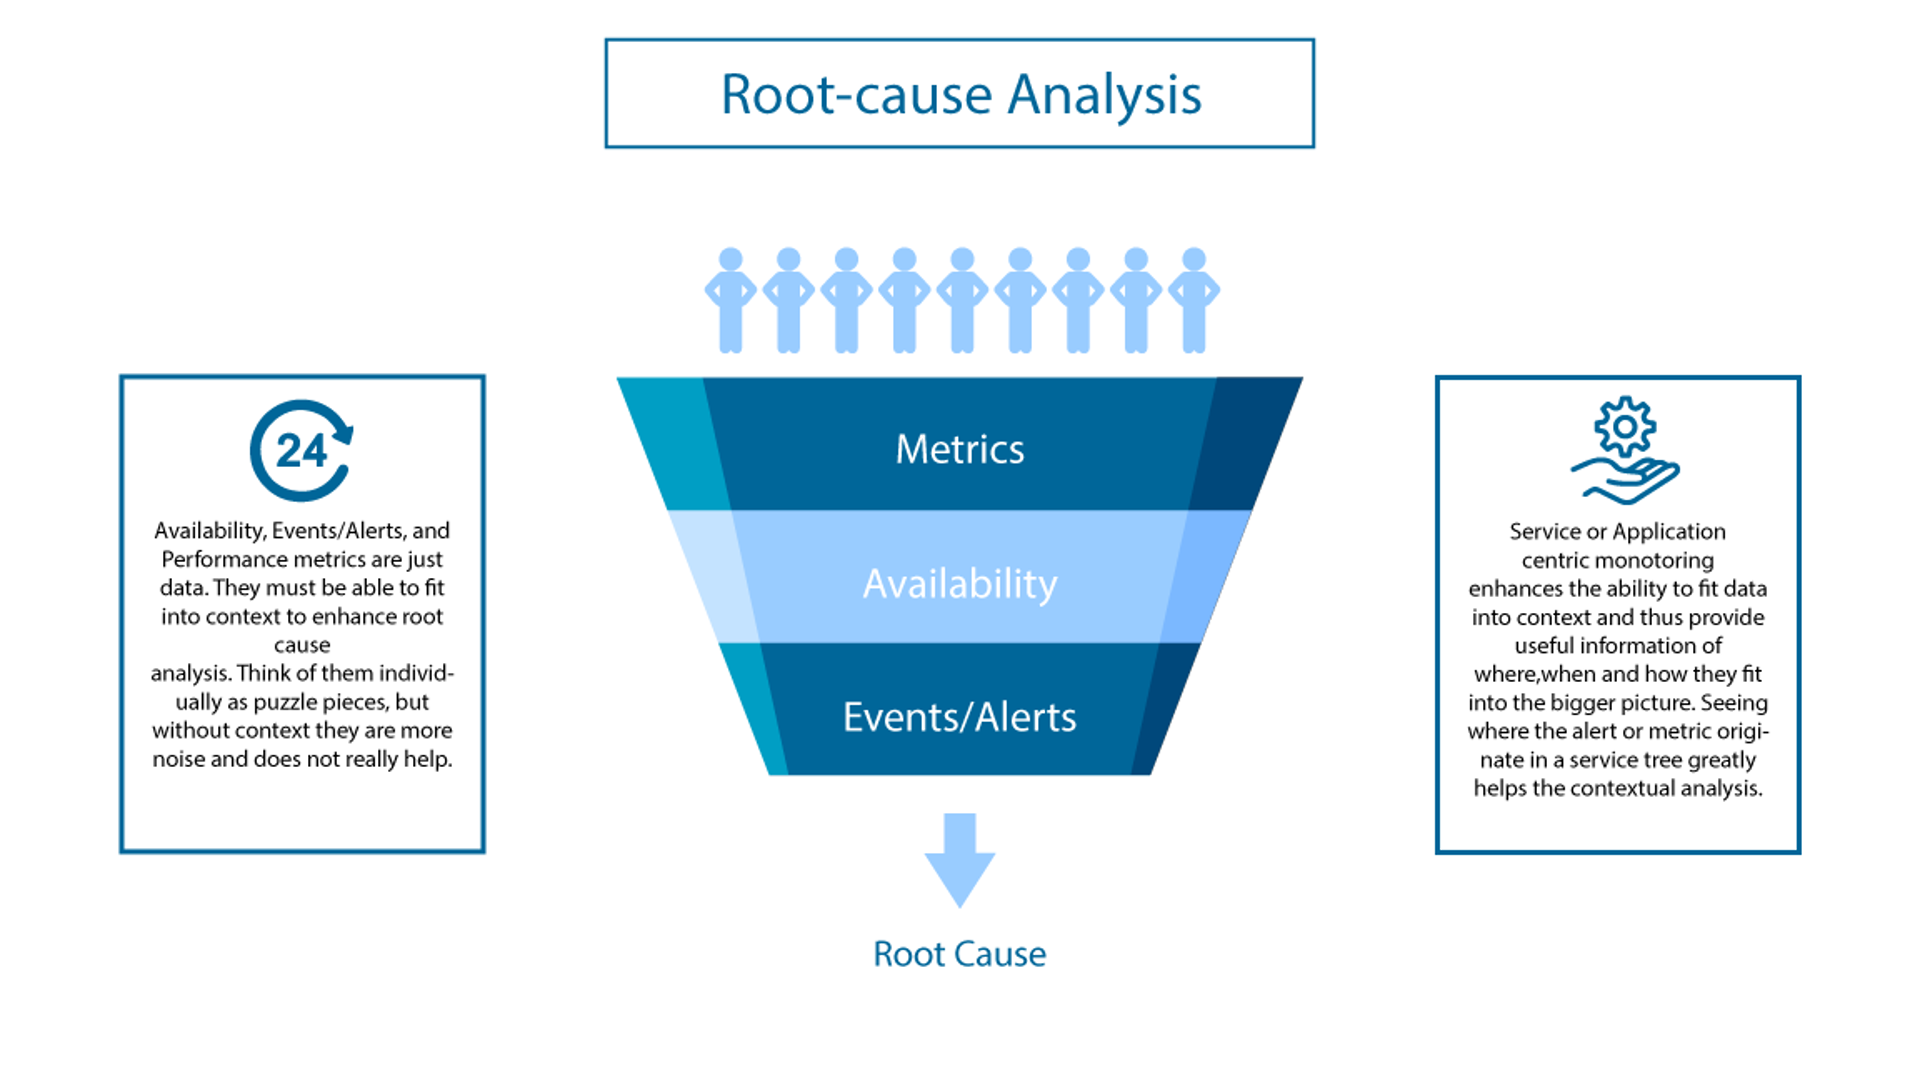
Availability, Events/Alerts, and Performance metric are just data. They must be able to fit into context to enhance root-cause analysis. Think of them individually as puzzle pieces, but without context they are more noise and doesn't really help.
Service of Application-centric monitoring enhances the ability to fit data into context and thus provide useful information of where, when and how they fit into the bigger picture. Seeing where the alert or metric originate in a service tree greatly helps the contextual analysis.
4. Time-synchronized Troubleshooting Context
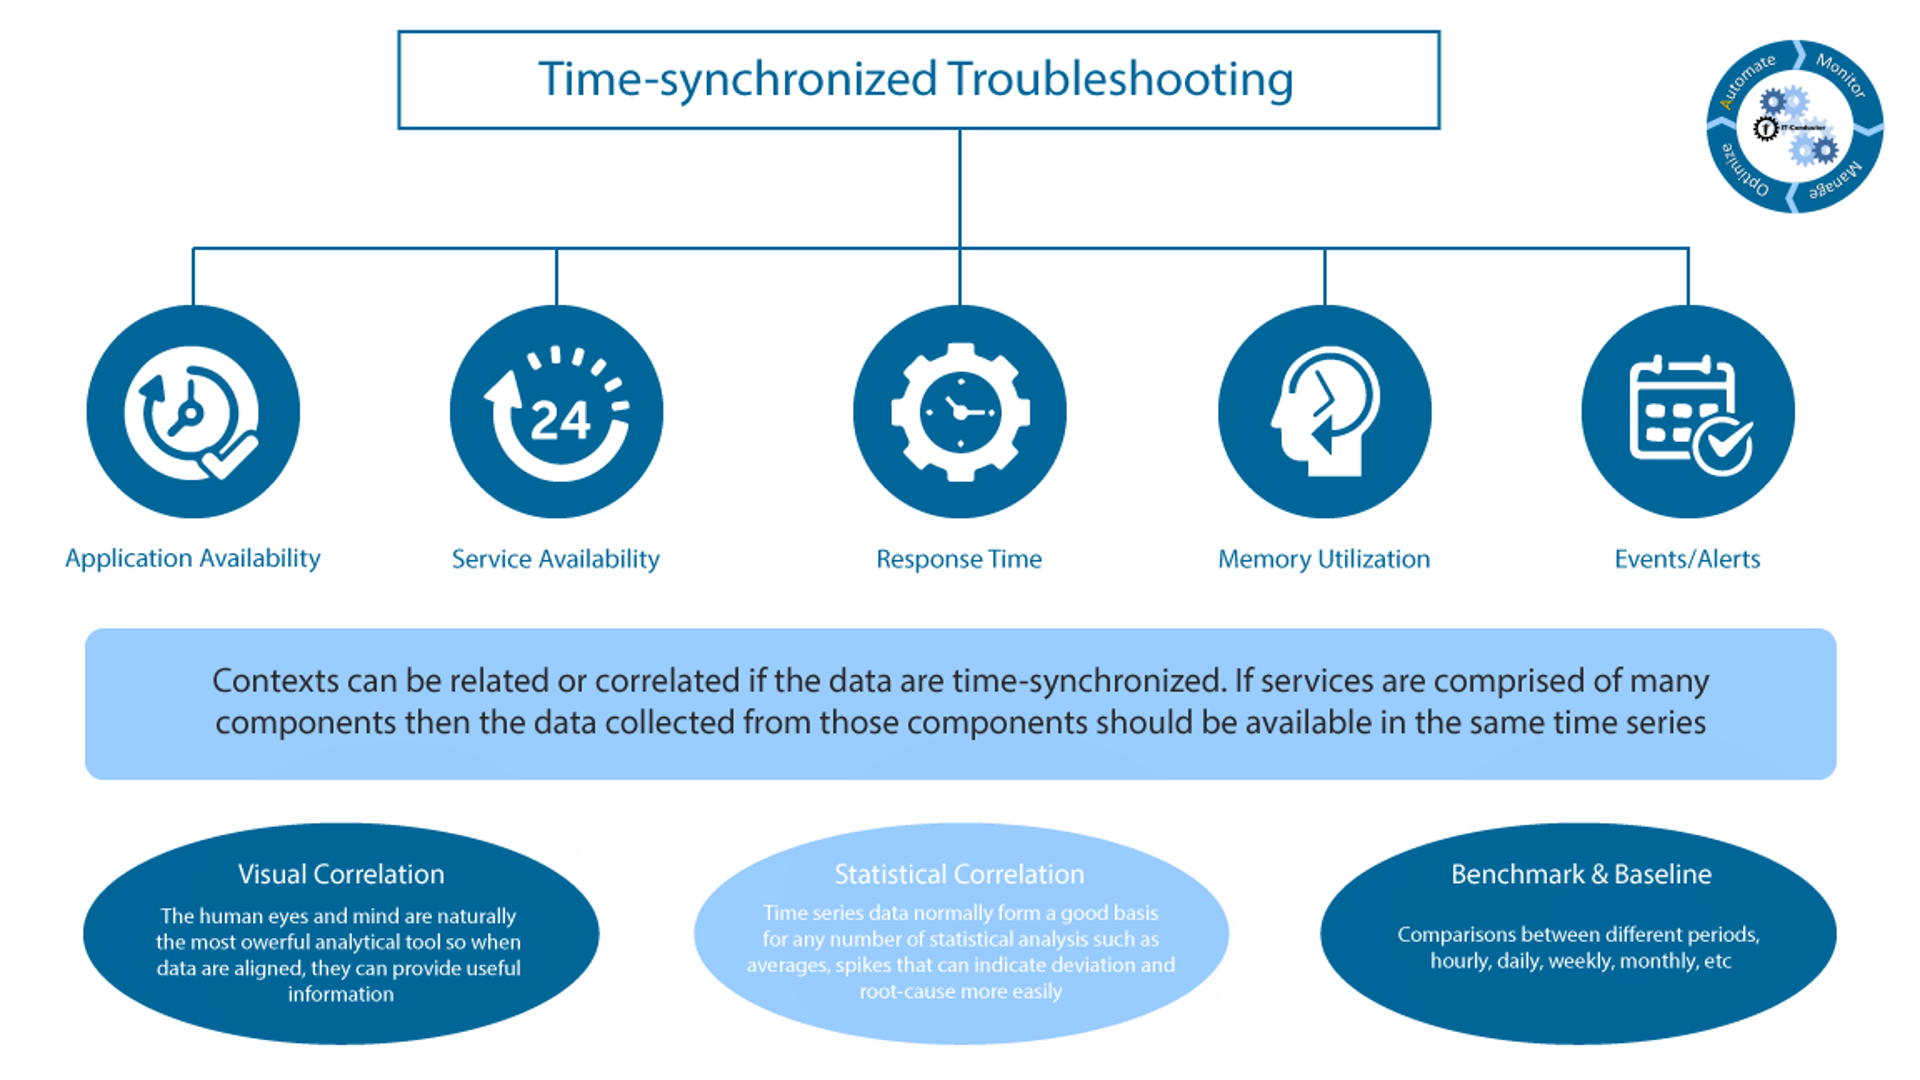
Contexts can be related or correlated if the data are time-synchronized. If services are comprised of many components then the data collected from those components should be available in the same time series.
Visual correlation: the human eyes and mind are naturally the most powerful analytical tool so when data are aligned, they can provide useful information.
Statistical correlation: time series data normally form a good basis for any number of statistical analysis such as averages , spikes that can indicate deviation and root-cause more easily.
Benchmark & baselines: comparisons between different periods, hourly, daily, weekly, monthly, etc.
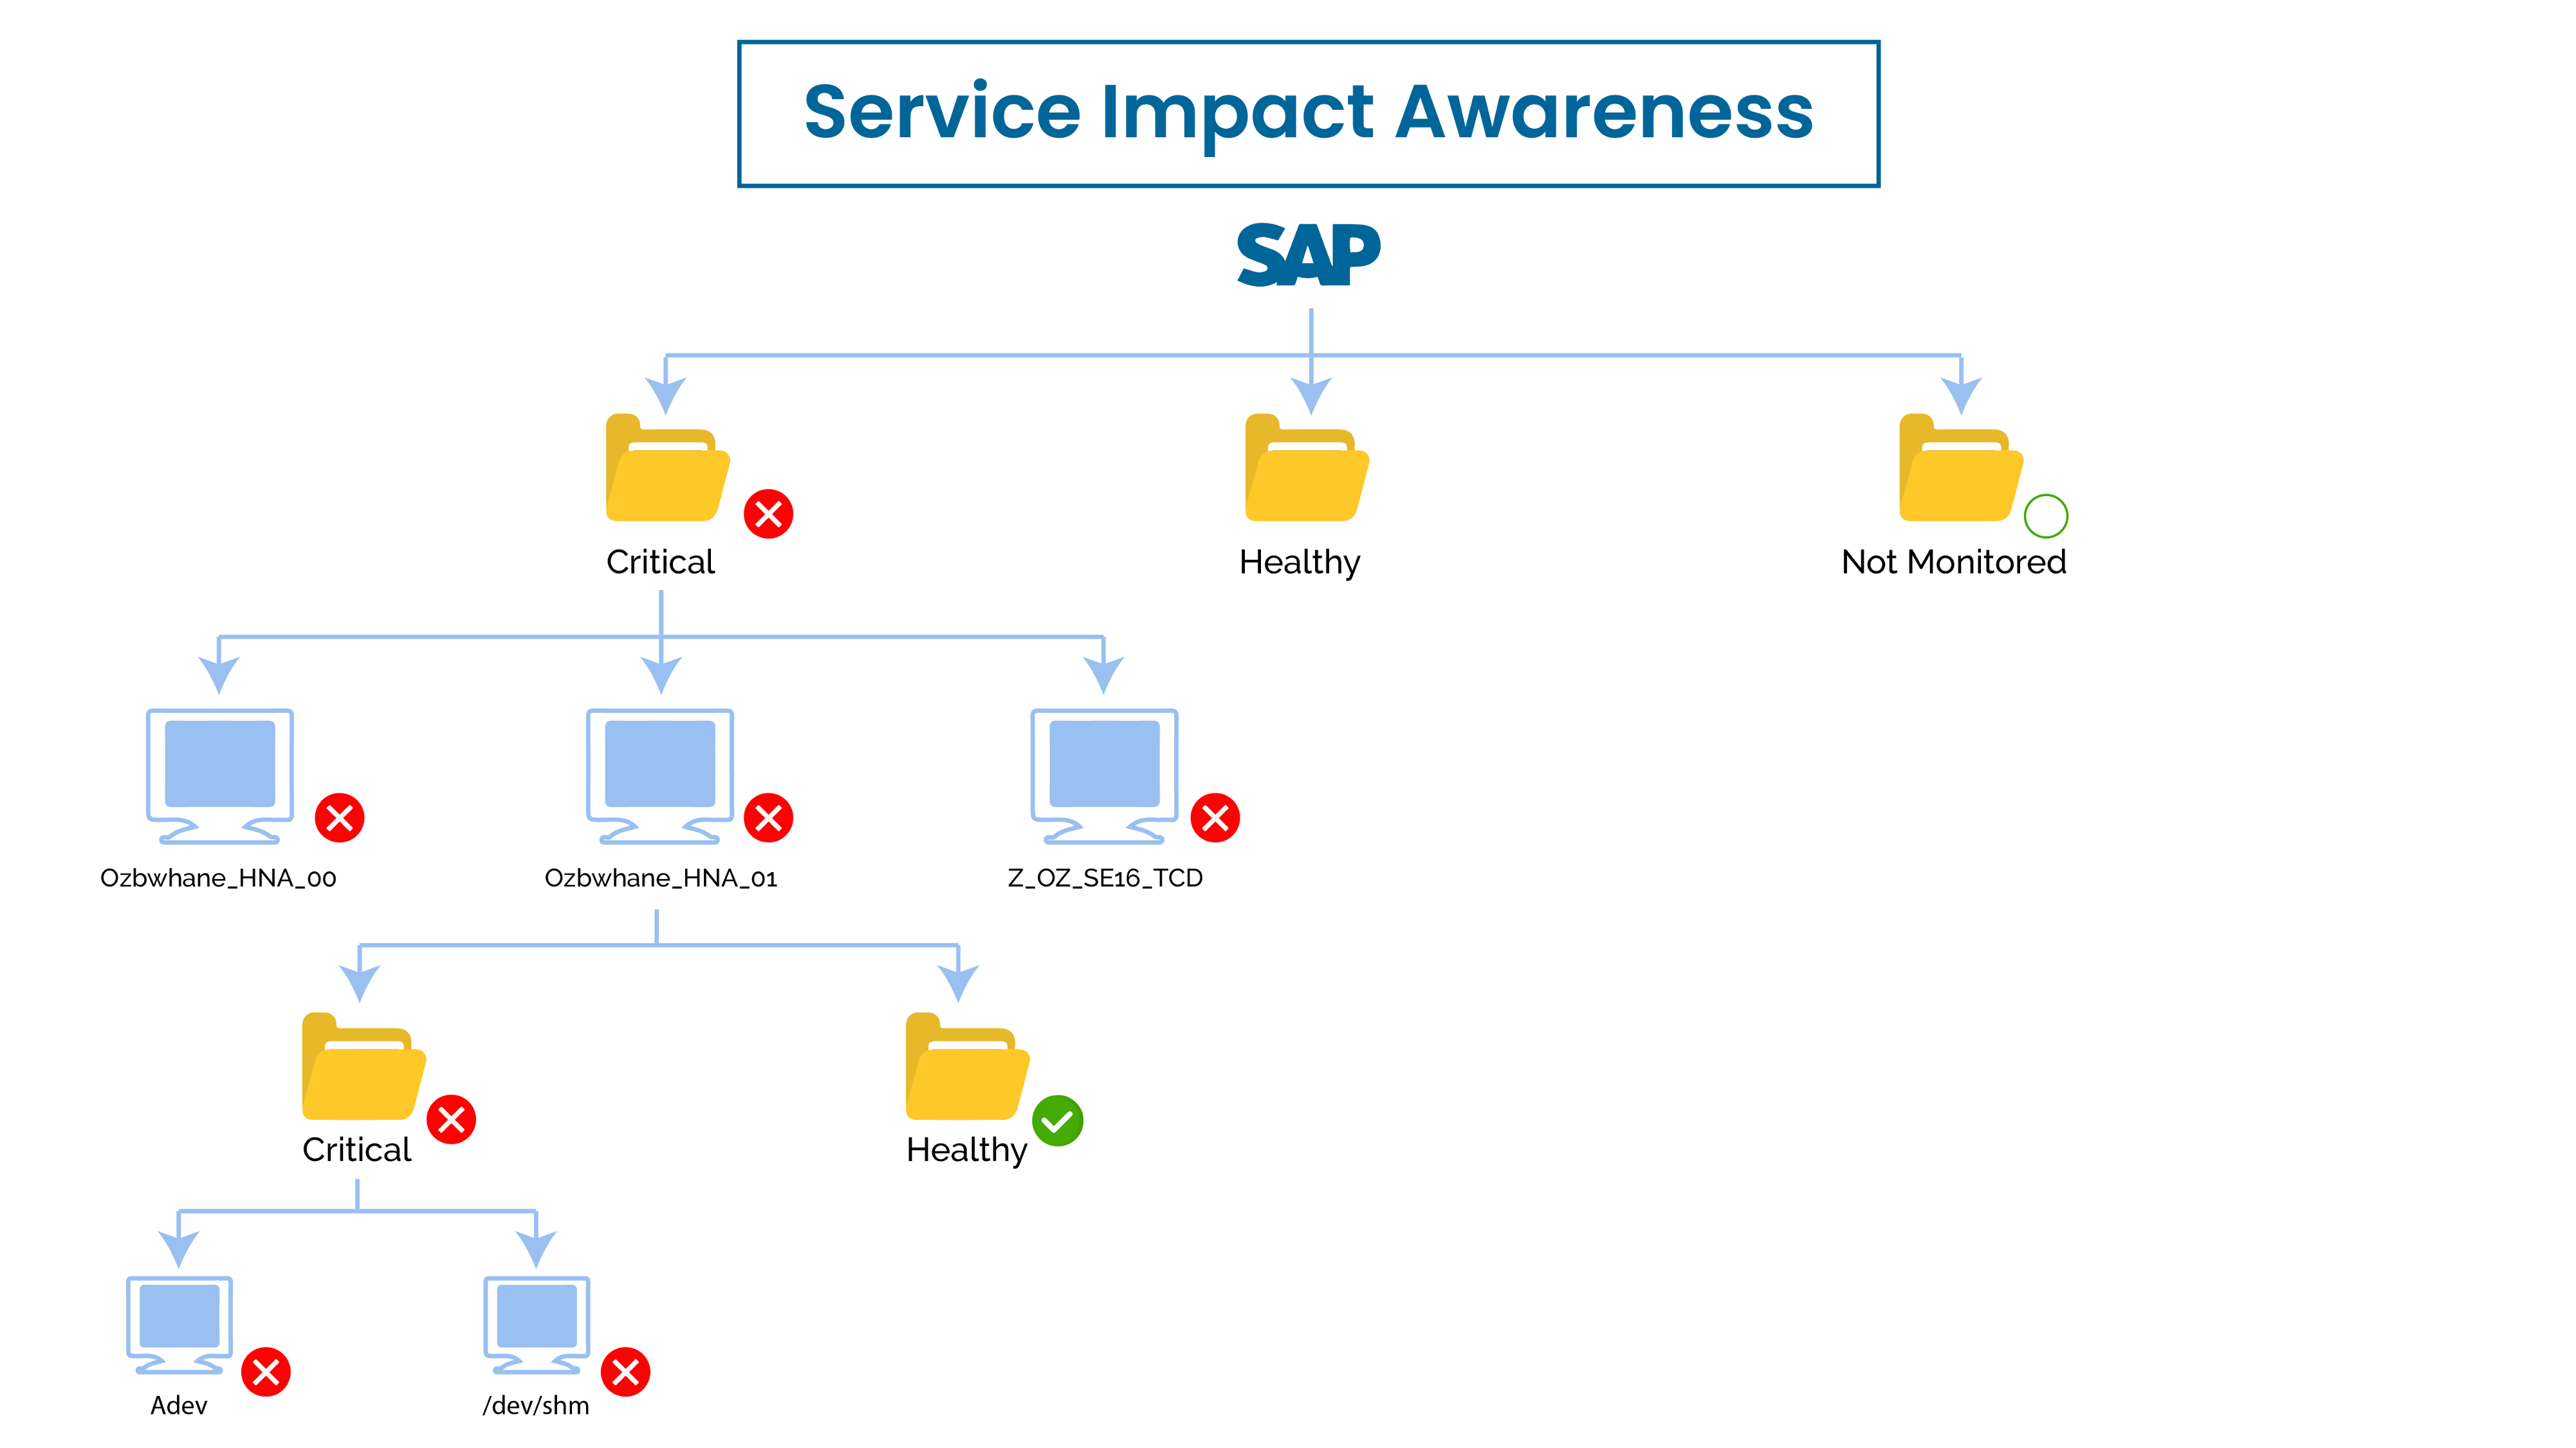
5. Service Impact Awareness
Service-centric monitoring allows the top-down as well as bottom-up propagation of events that impact related components.
Flexible service definitions can assign relationships as well as rules/weight how one should impact other, e.g. if a server is busy and unable to service requests for 10 minutes, then change its status to critical and propagate the impact to the overall application service as warning - the overall service may still be available but degraded as other load balanced servers can still service other requests.
Role-based subscription determines who should get notified depending on what's being impacted & severity.
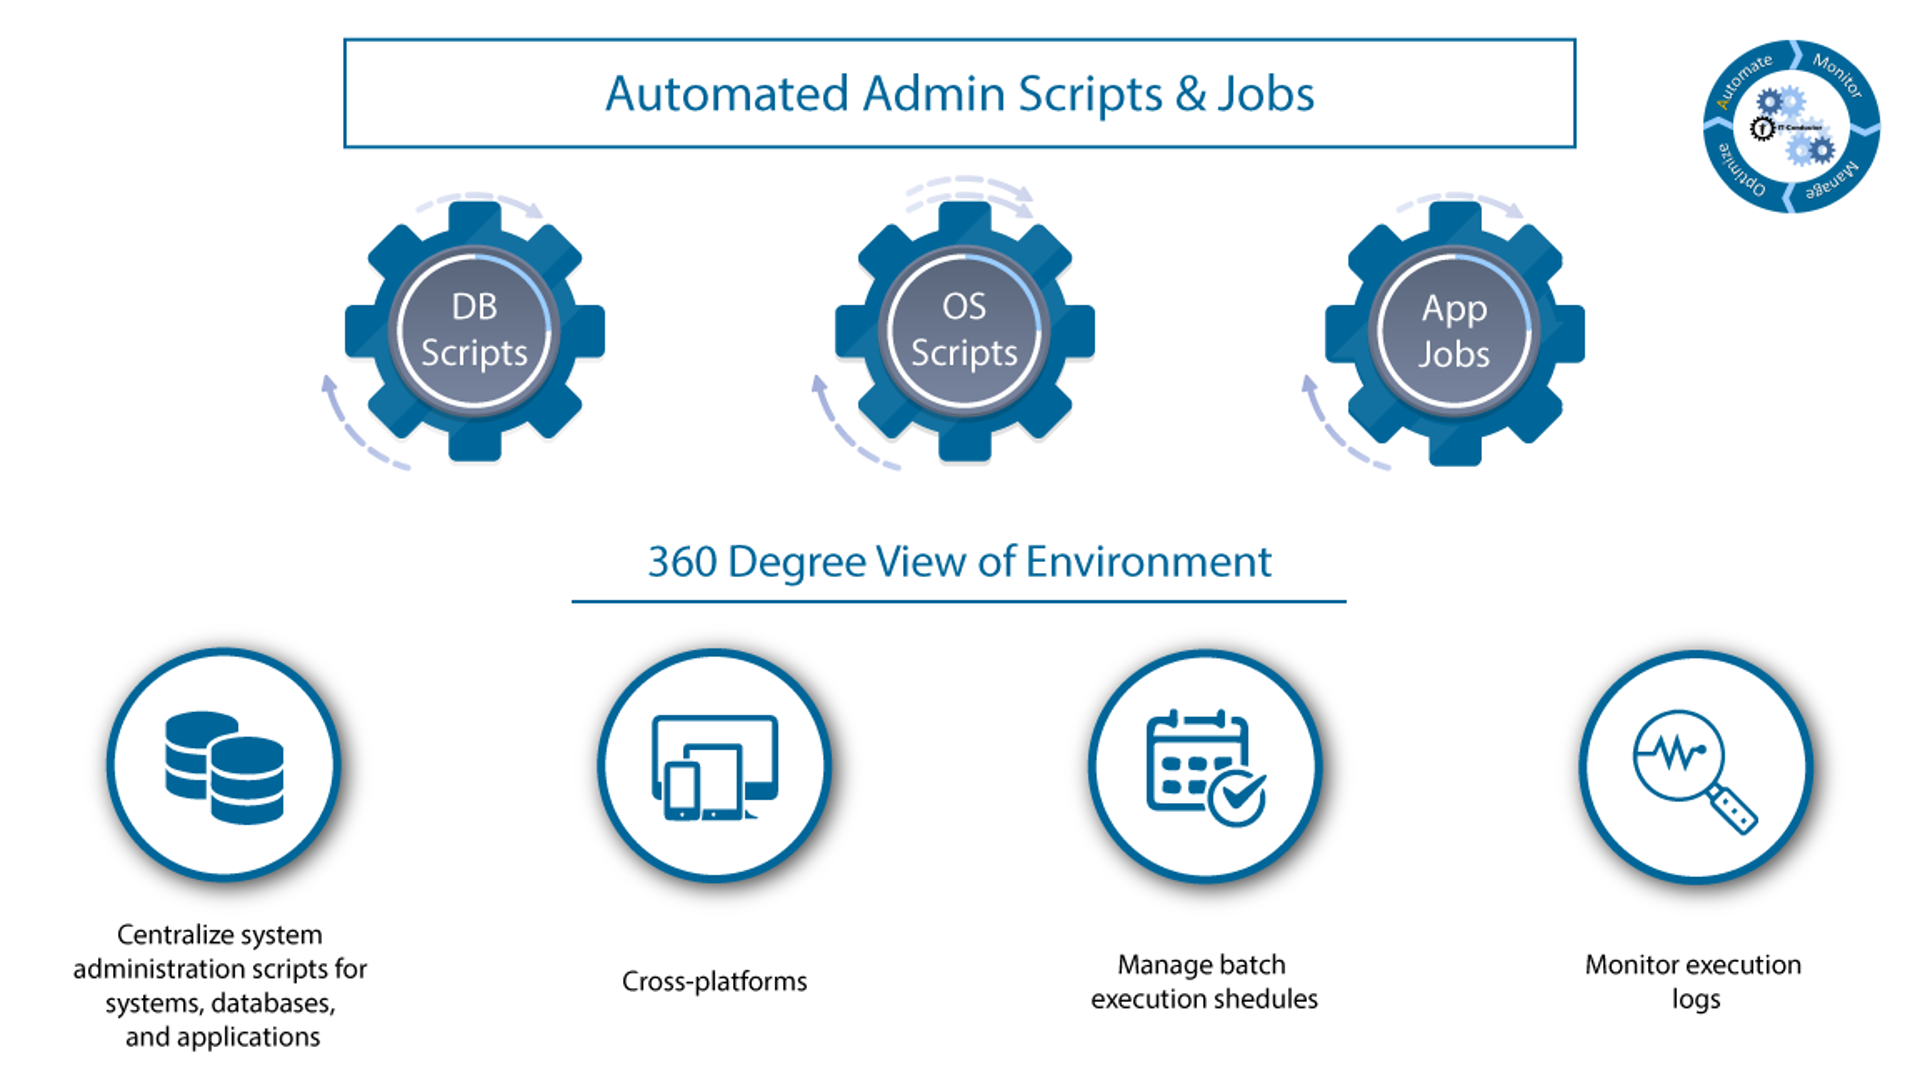
6. Automated Admin Scripts & Jobs
Centralize system administration scripts for systems, databases, and applications.
Cross-platforms
Manage batch execution schedules
Monitor execution logs
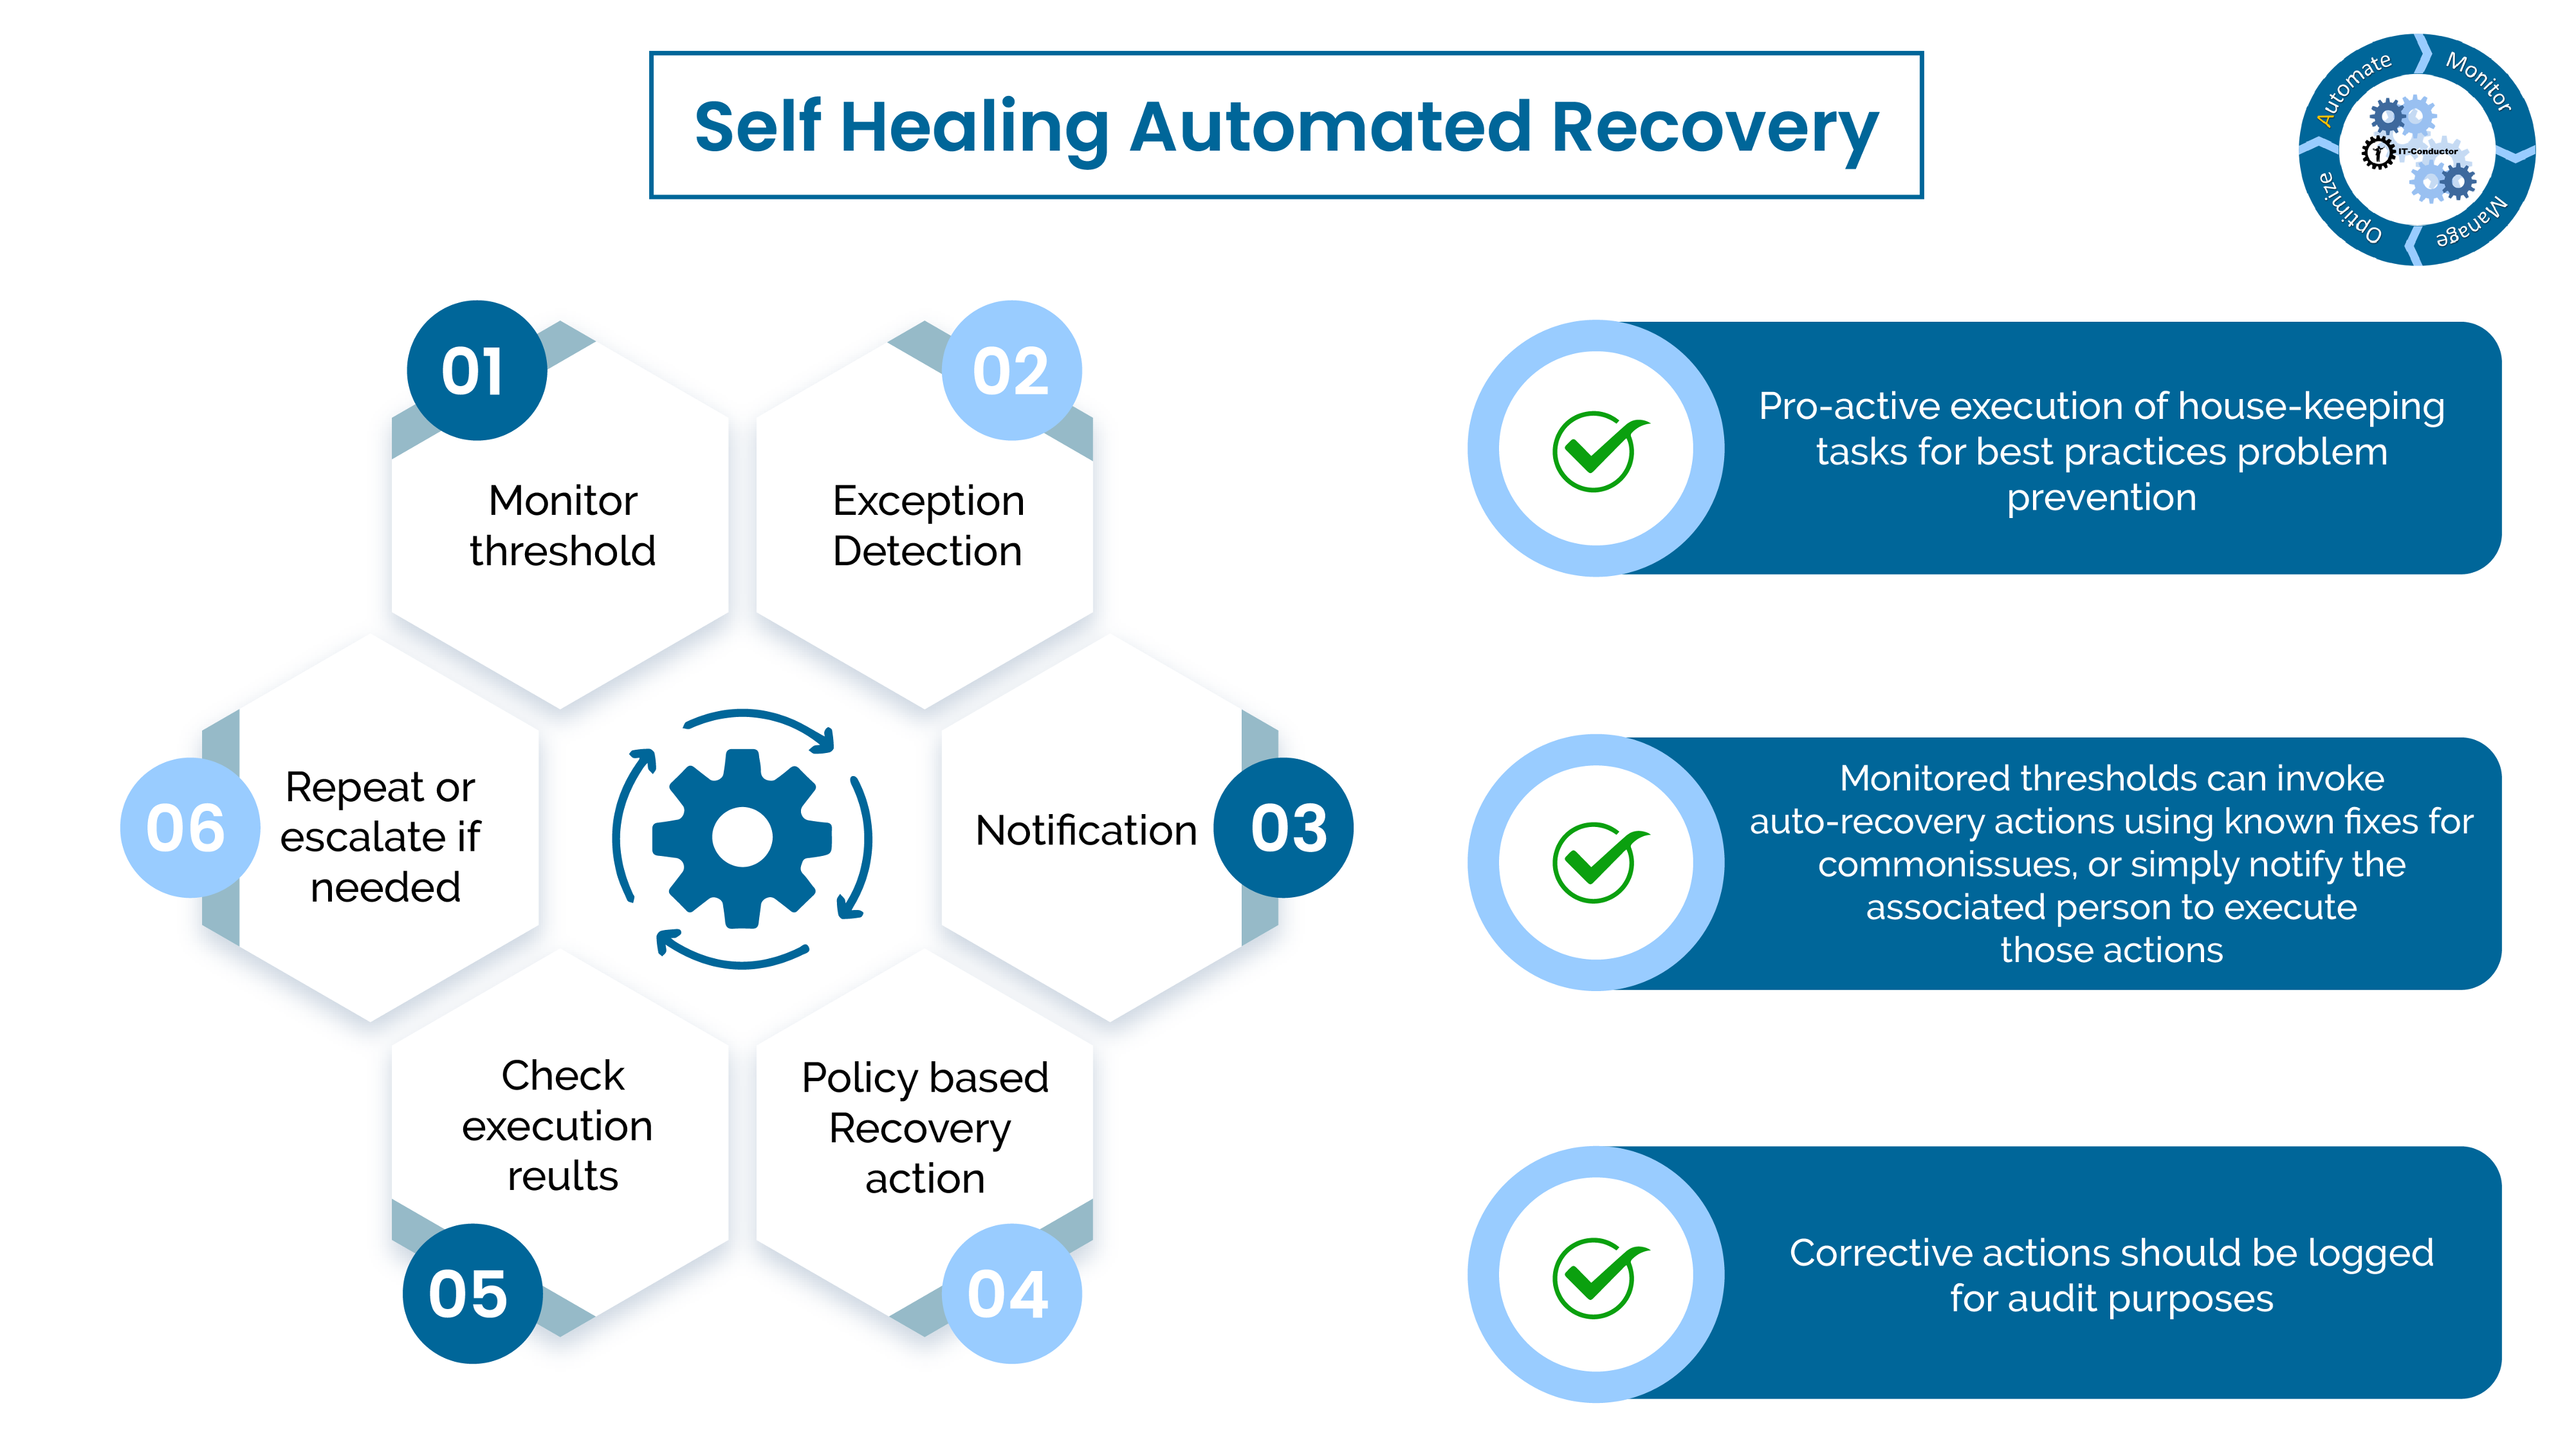
7. Self-healing Automated Recovery
Pro-active execution of house-keeping tasks for best practices problem prevention.
Monitored thresholds can invoke auto-recovery actions using known fixes for common issues, or simply notify the associated person to execute those actions.
Corrective actions should be logged for audit purposes.
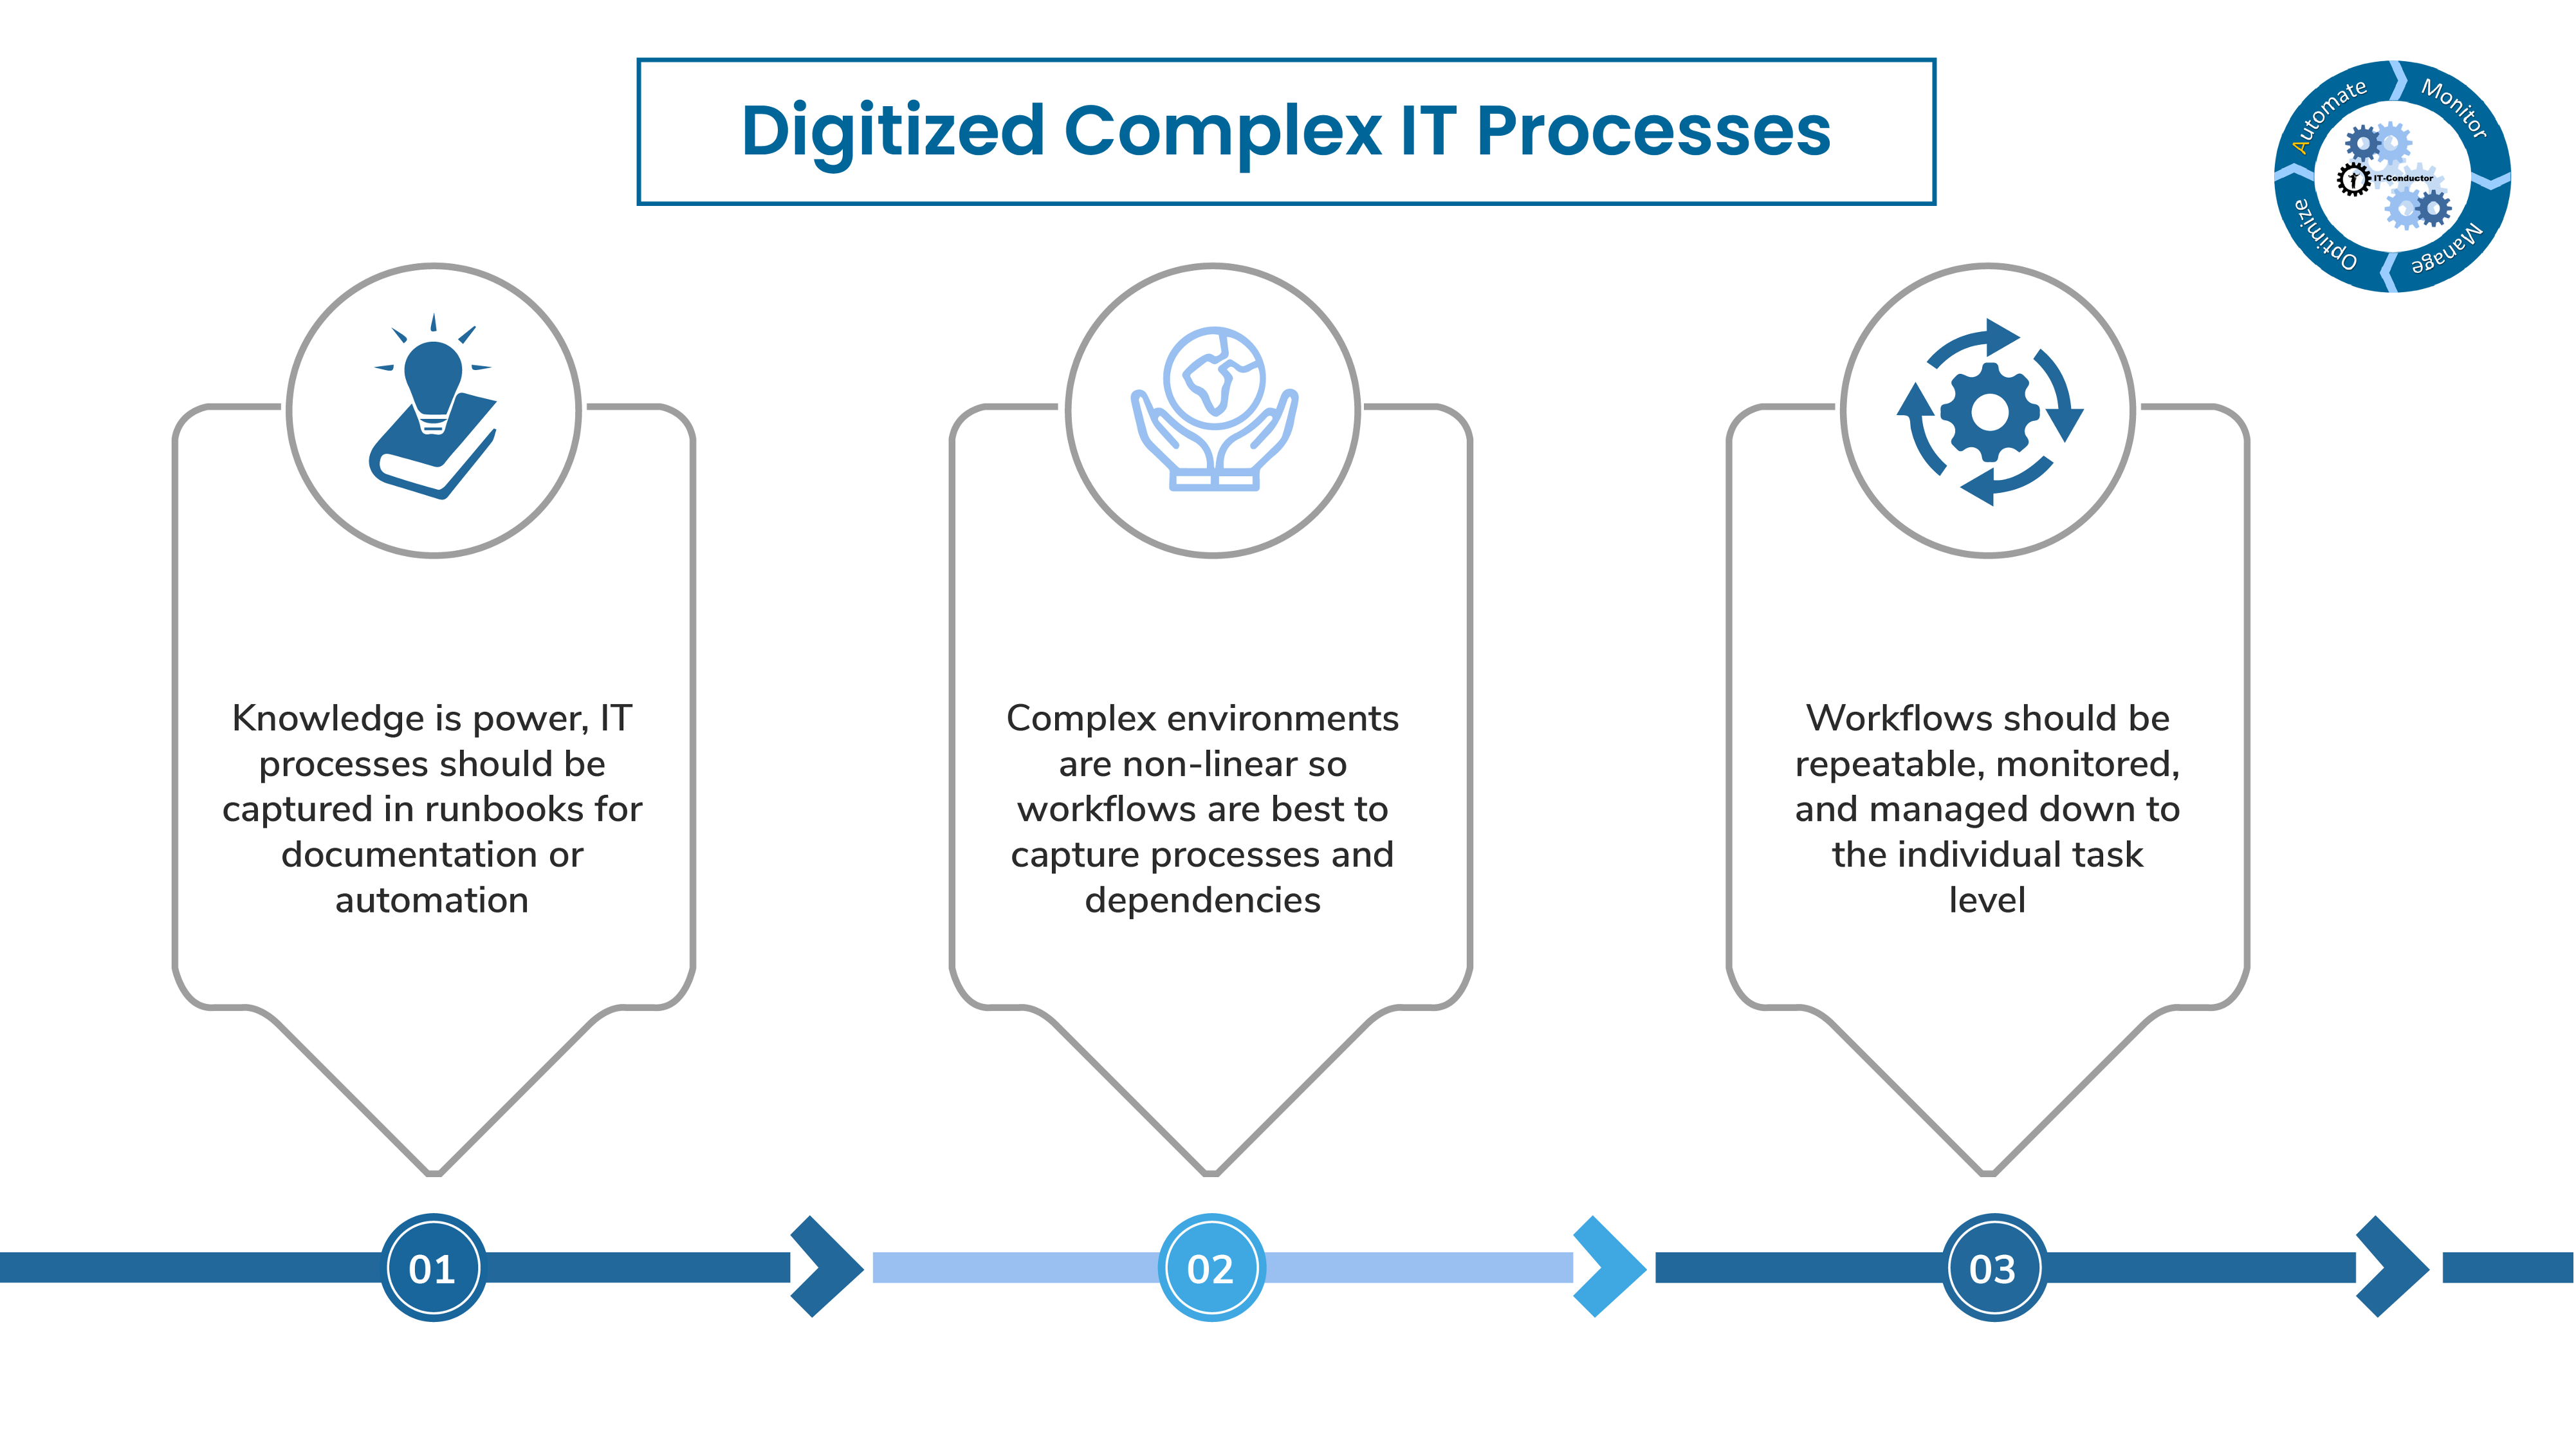
8. Digitalized Complex IT Processes
Knowledge is power, IT processes are be captured in runbooks for documentation or automation.
Complex environments are non-linear so workflows are best used to capture processes and dependencies.
Workflows should be repeatable, monitored and managed down to the individual task level.
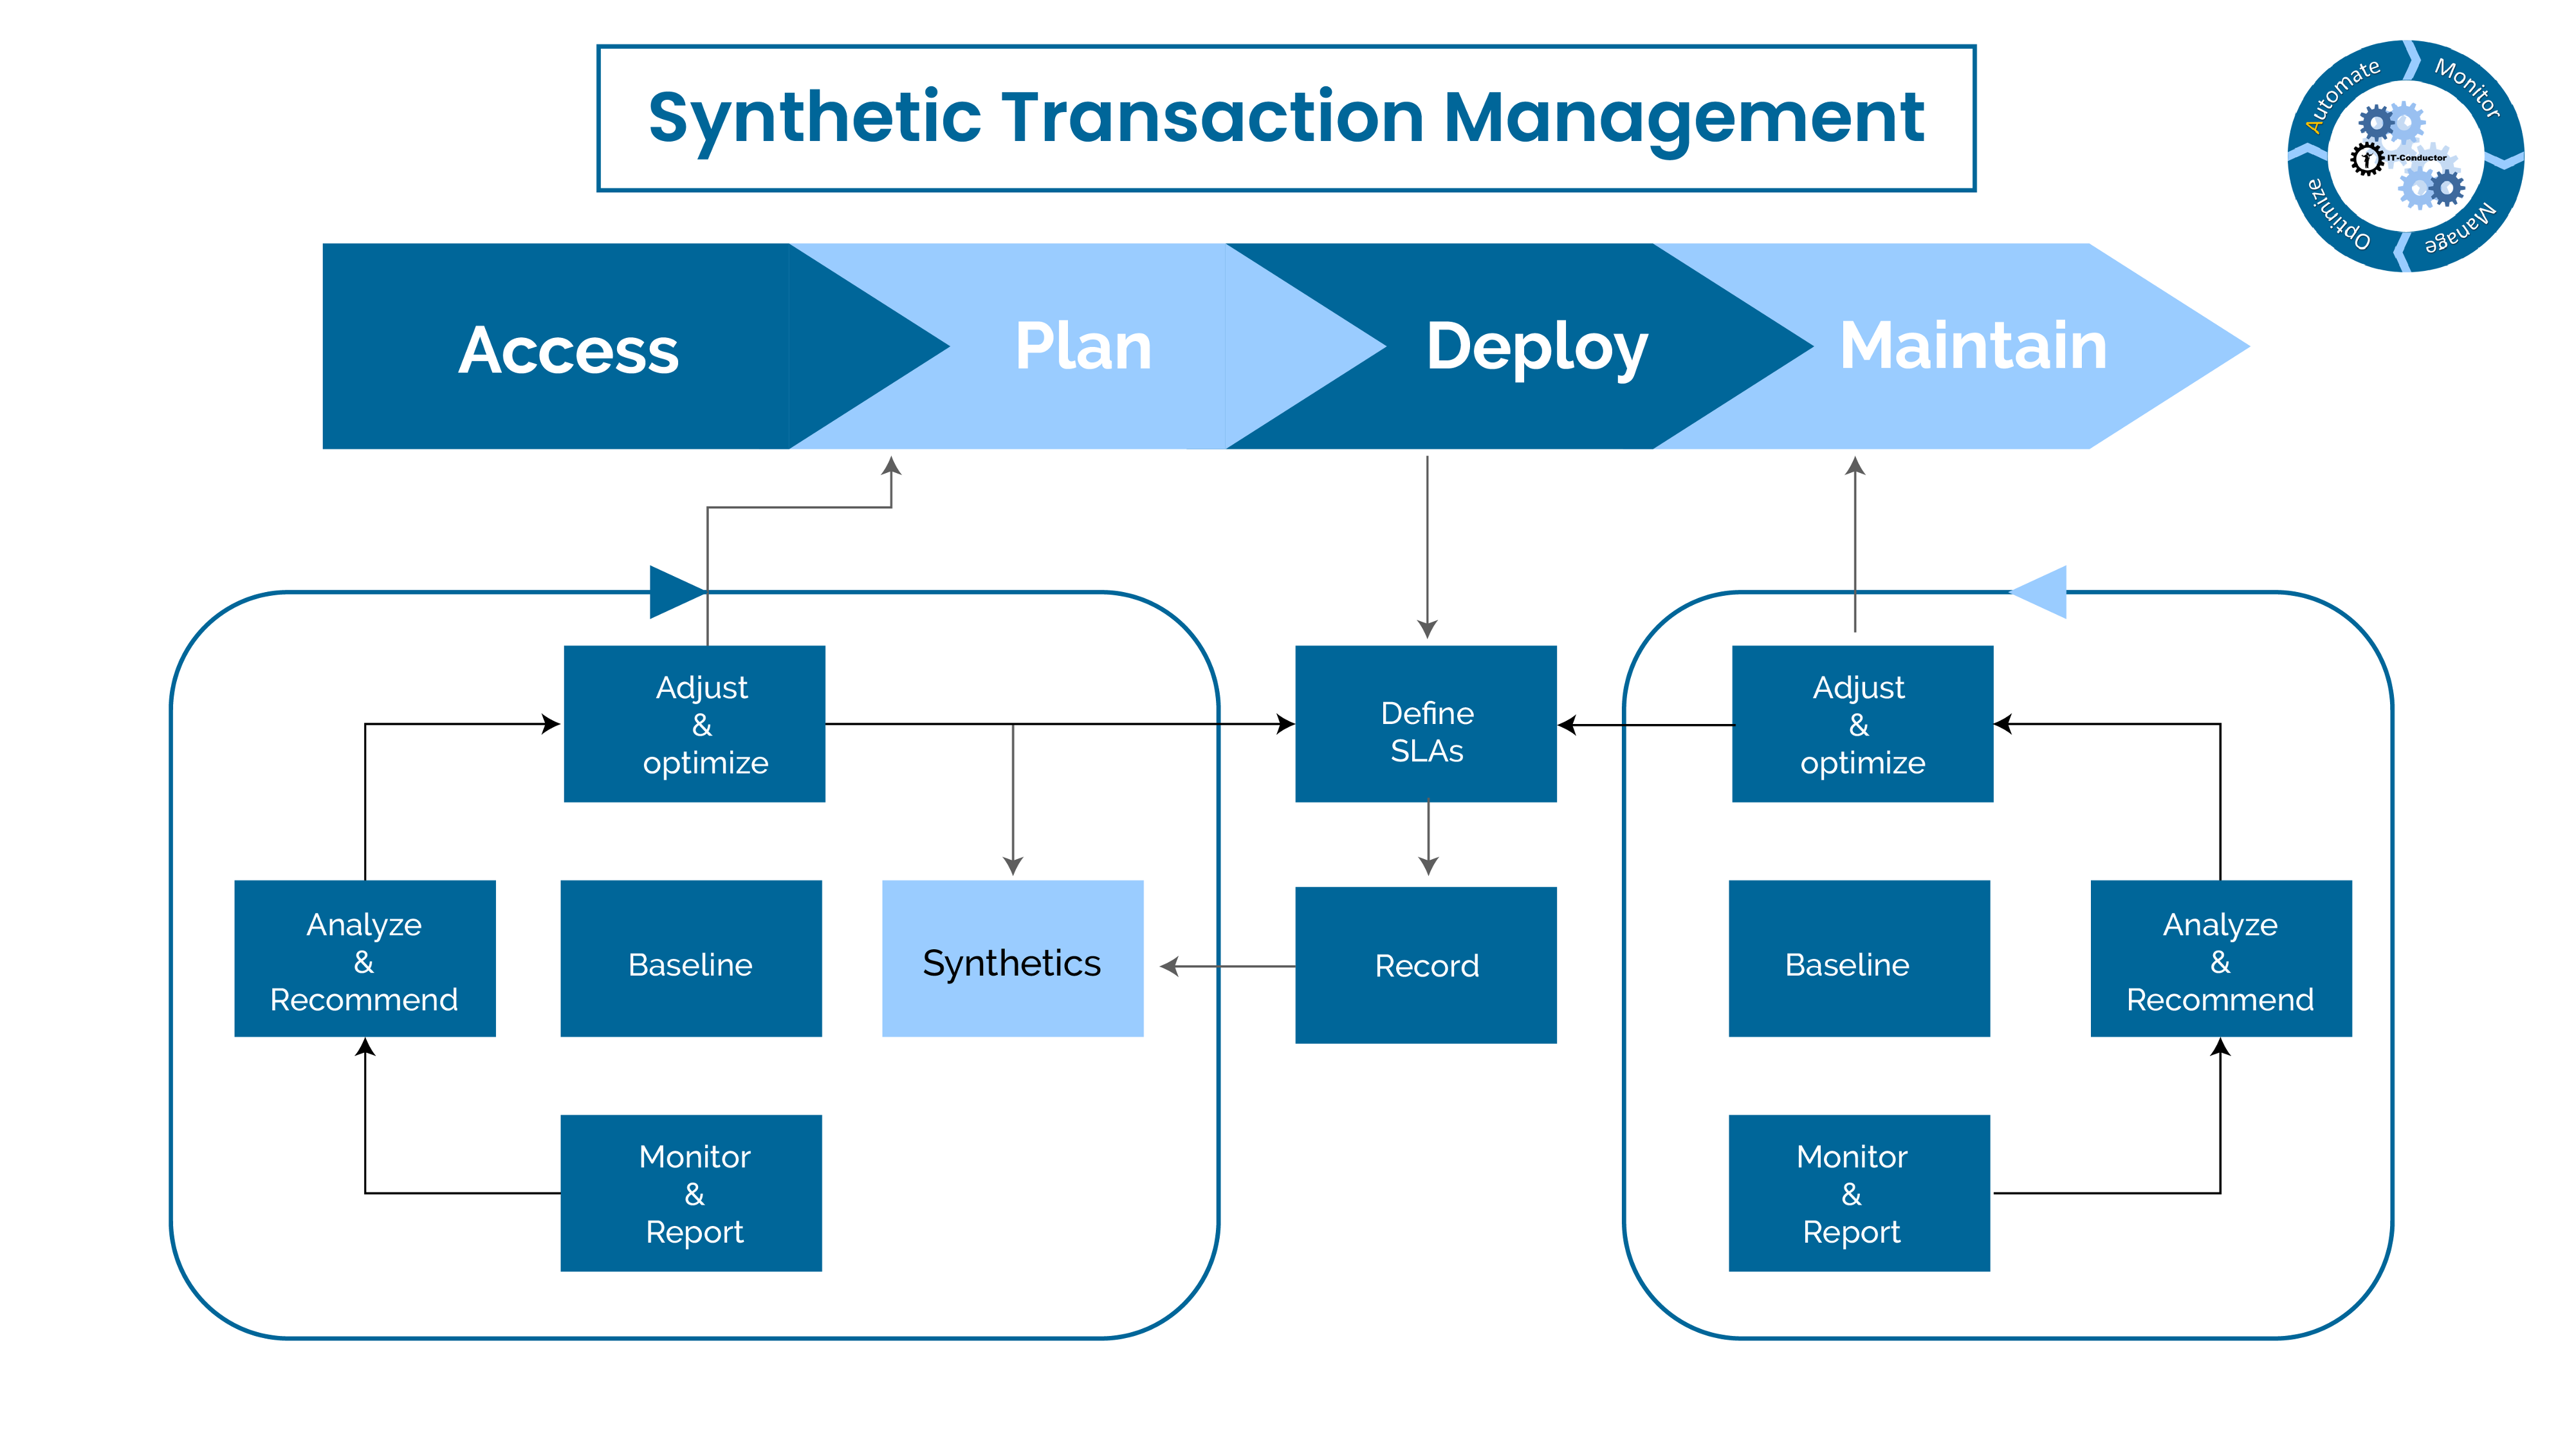
9. Synthetic Transaction Management
Test critical processes on a frequent basis to ensure that availability and performance service levels for them are constantly monitored.
When possible. simulate end-user experience from various points of entry to the service or application using robots or scripts that can be triggered centrally but executed remotely.
Baseline performance during different time periods got trend-analysis and exception-based alerting.
Transaction-level monitoring
Integration with Performance Load Testing
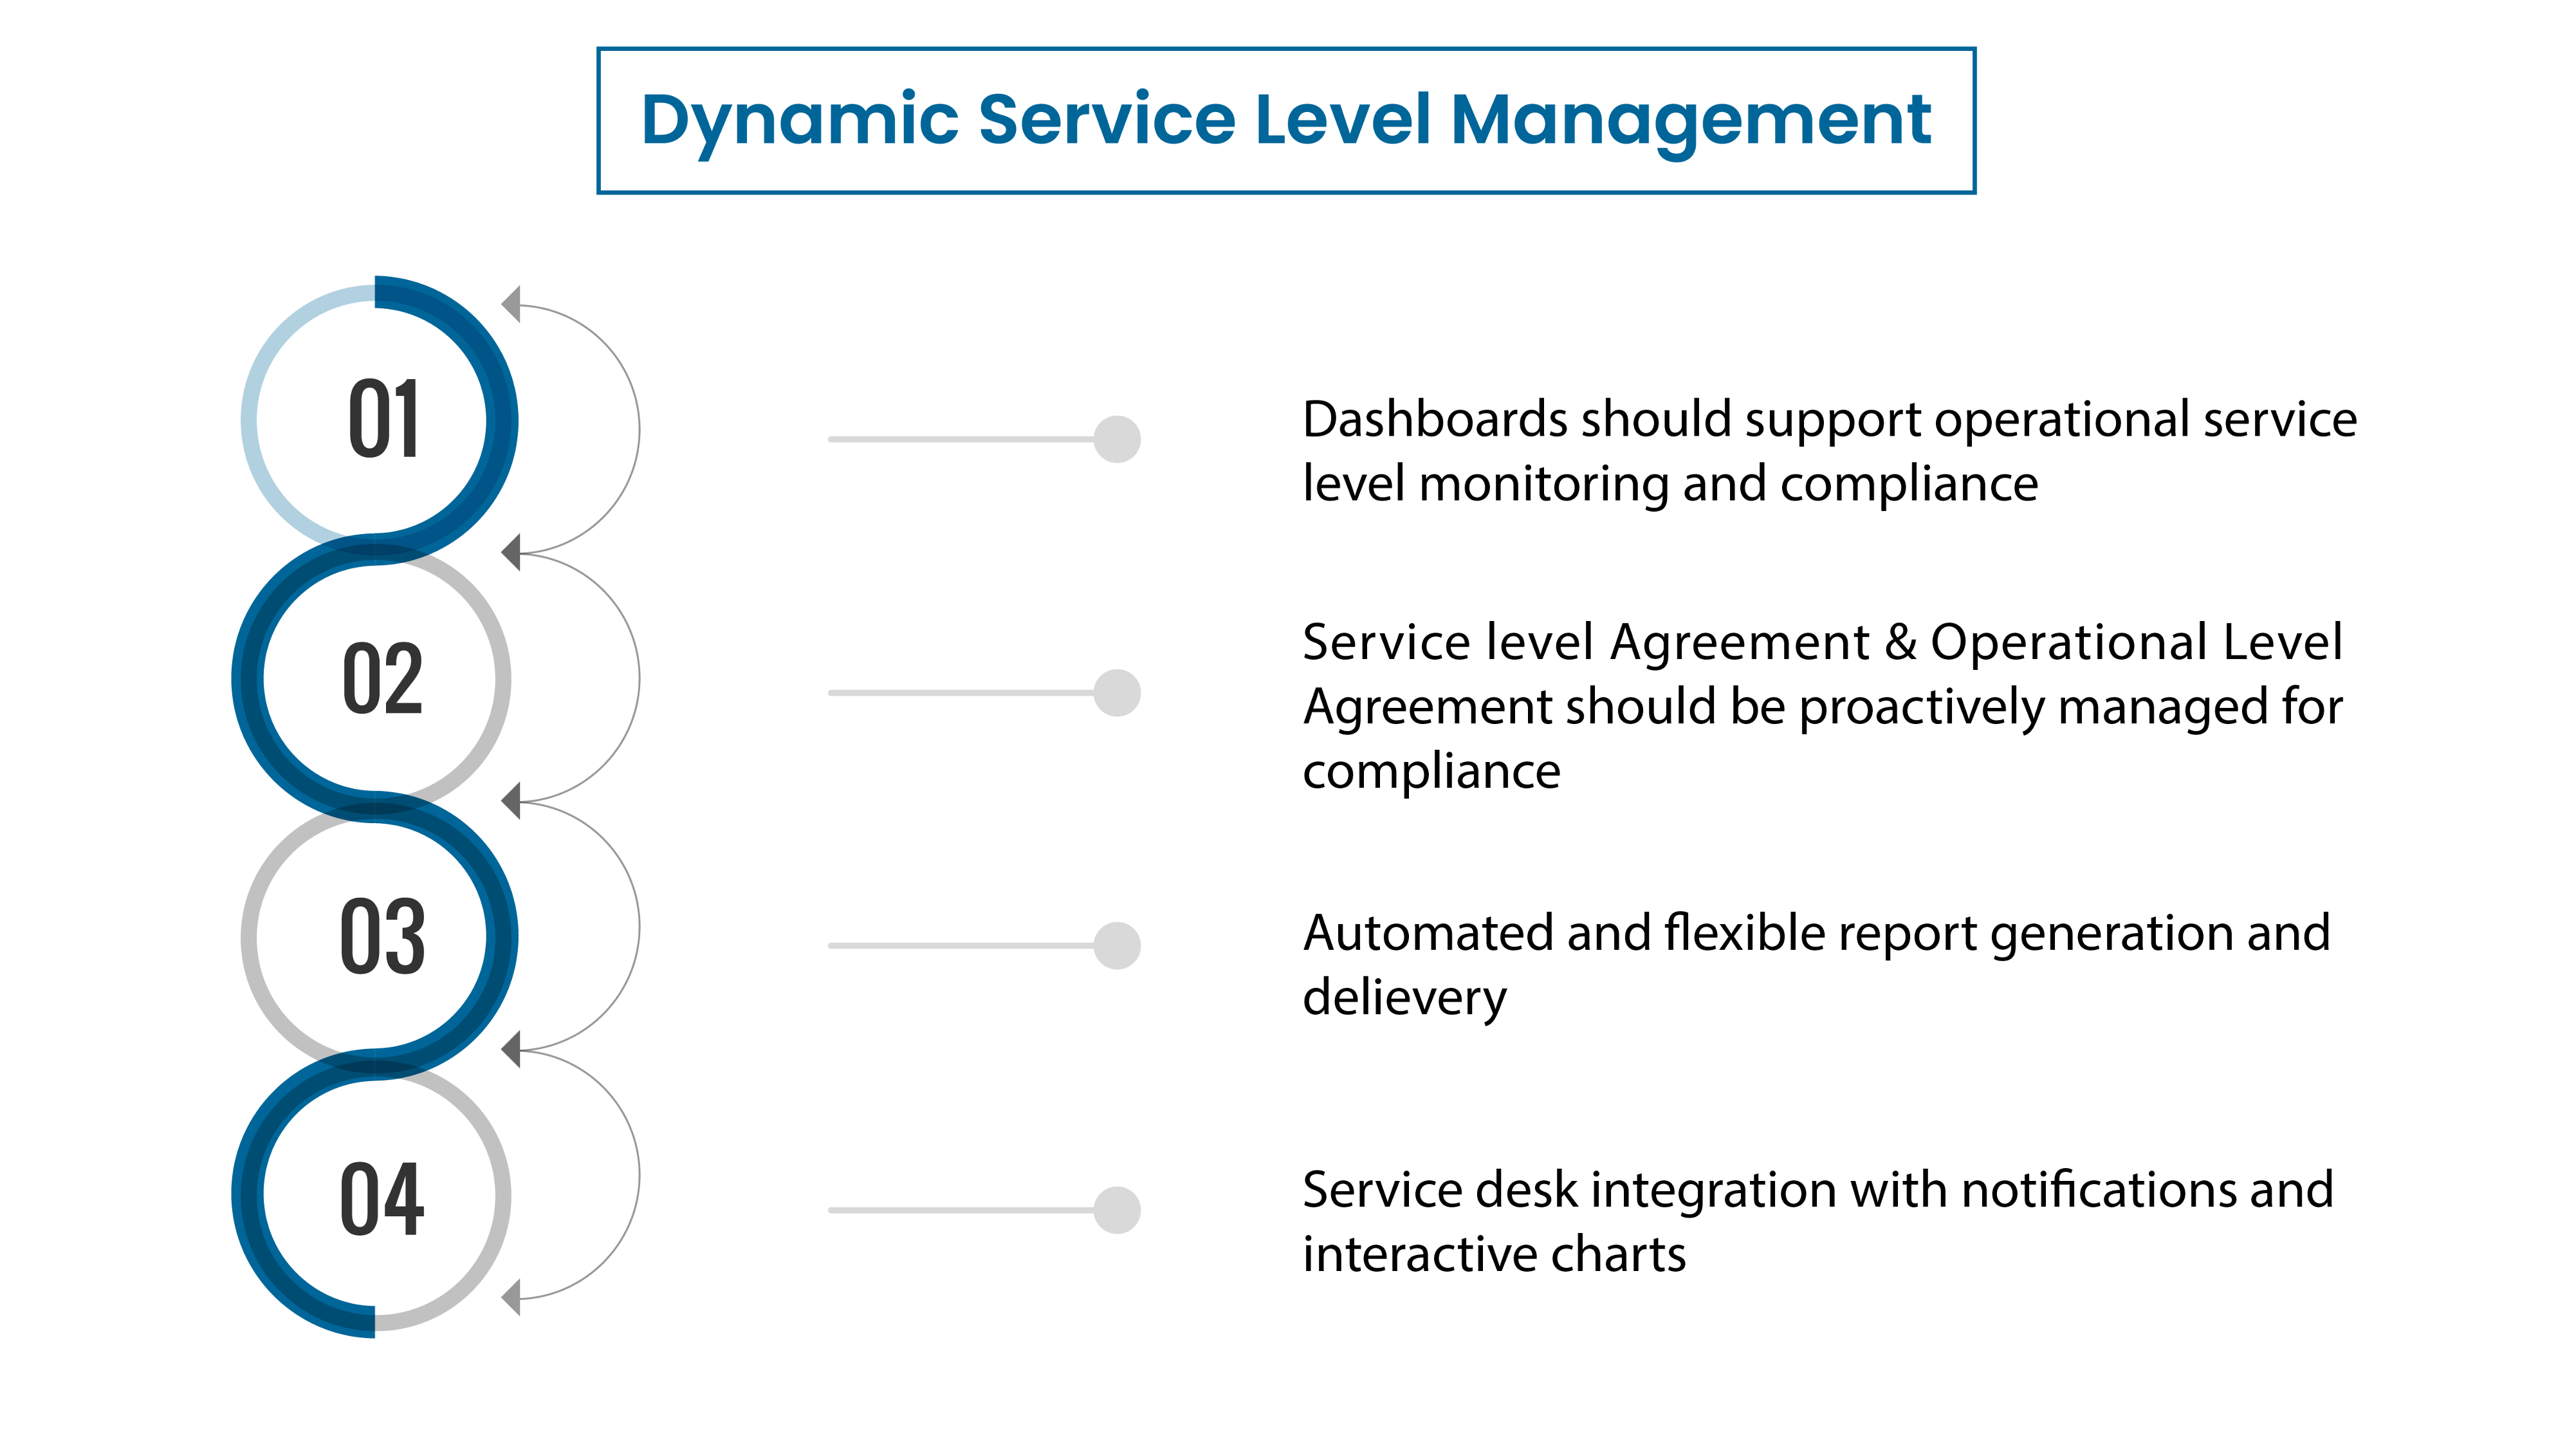
10. Dynamic Level Management
Dashboards should support operational service level monitoring and competence.
Service Level Agreement & Operational Level Agreement should be proactively managed for compliance.
Service desk integration with notifications and interactive charts.
Discover how IT-Conductor can help you automate your systems.