Another exciting time is here again when we share with you a few of the improvements and additions we've made to IT-Conductor since the last quarter. We consider it imperative to continually provide our customers with the solutions they need to meet their needs irrespective of the business challenges.
In this Q2-2020 edition, you will discover tools that will help you better monitor and manage your systems proactively. A teaser for Q3, we're working on several common SAP deployment templates for end-to-end SAP/HANA systems provisioning and software installation through our Infrastructure-as-code automation.
- Tenant Overview Dashboard
- SAP Transport Management Enhancements
- Reporting Git (Github, bitbucket, etc.) Integration
- Monitoring Network Ping Response Time
1. Tenant Overview Dashboard
These are dashboards depicting Operational Alerts, Recovery Actions, and a top-level overview of a customer's environment. The alerts and recovery actions (such as Printer restart, User Password Reset, Threshold-based DB backup, etc.) of all the systems that constitute your environment are segmented by day, week, and month to provide a system performance view across various time frames. Blended in this latest dashboard are the new horizontal bar charts which neatly delineate each system in different colors for easy identification and analysis.
From this view, you can easily take a deep dive into any area of your system landscape with just a few clicks. Possible actions you can perform from this view include Report creation, Export of Chart Data, a preview of alert/recovery action details, and many more.
Figure 1: Tenant Overview Dashboard
2. SAP Transport Management Enhancements
SAP Transport automation was unveiled in the Q1 edition of the Latest features in IT-Conductor and has since been enhanced to display import logs of the transport list. Furthermore, there is now the functionality for Transport Compare between two systems, irrespective of the transport type. This functionality will be beneficial in a System refresh scenario where there is a need to identify transports existing in the QA system but not in the PROD system so that they can be re-imported again as part of the Post-Copy Automation. Also, the Transport difference list after the comparison is easily accessible in CSV format via email.

Figure 2: SAP Transport Management
3. Reporting Git (Github, bitbucket, etc.) Integration
IT-Conductor now enables DevOps teams to extend their set of tools through the use of a library of pre-built report definitions. With this functionality, they can store and edit their custom reports in any git repository of their choice.
4. Monitoring Network Ping Response Time
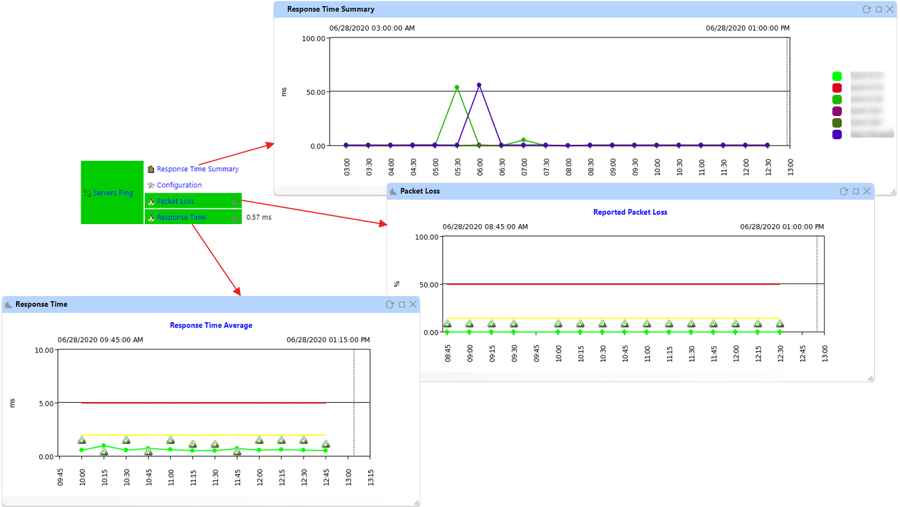
This is a network latency monitoring functionality that proactively monitors the network of critical app servers in your environment. It enables quick identification of degraded network performance between servers (backend inter-server communication) in your system landscape, and also gives insight into the root cause of network problems by probing the average response time between servers. It is useful to system admins for detecting network problems early enough before escalating to the network team if need be. This can potentially reduce the degree of network impact on app servers in your environment.
There is a provision for a monitor chart displaying the maximum response time of all interval values as well as a Response Time Summary chart that reports the historical values for all pinged hosts in your environment. Other features include the Packet loss chart and a Configuration tool that allows you to set metrics as you deem fit. Also, alerts are sent for individual hosts if they are not pinging within the set criteria.

Figure 3: Monitoring Network Ping Response Time
Contact us if you would like to enable these new features in your account, or if you would like to try IT-Conductor.
