Server Monitoring
Track server availability and ensure peak performance to keep your applications running smoothly and your services accessible at all times. Ensure seamless operations and uninterrupted service delivery for your customers.
![]()

Explore key features tailored for monitoring Linux and Windows environments. Learn More →
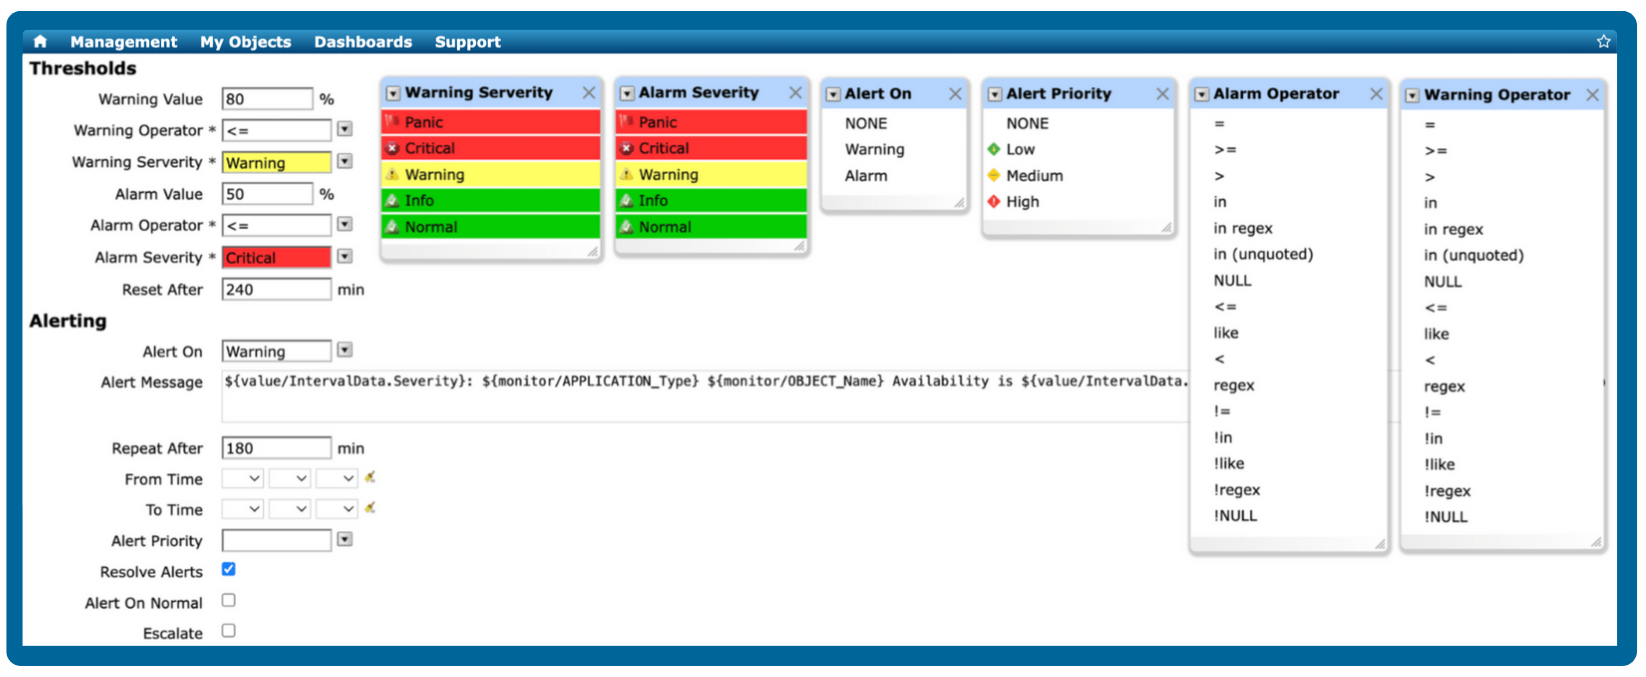
Enhance visibility into server performance with custom alerts and notifications
Take charge of your monitoring experience with precision by setting up custom thresholds and alerts. Ensure proactive monitoring by setting up notification e-mails and delivering timely alerts to designated team members.
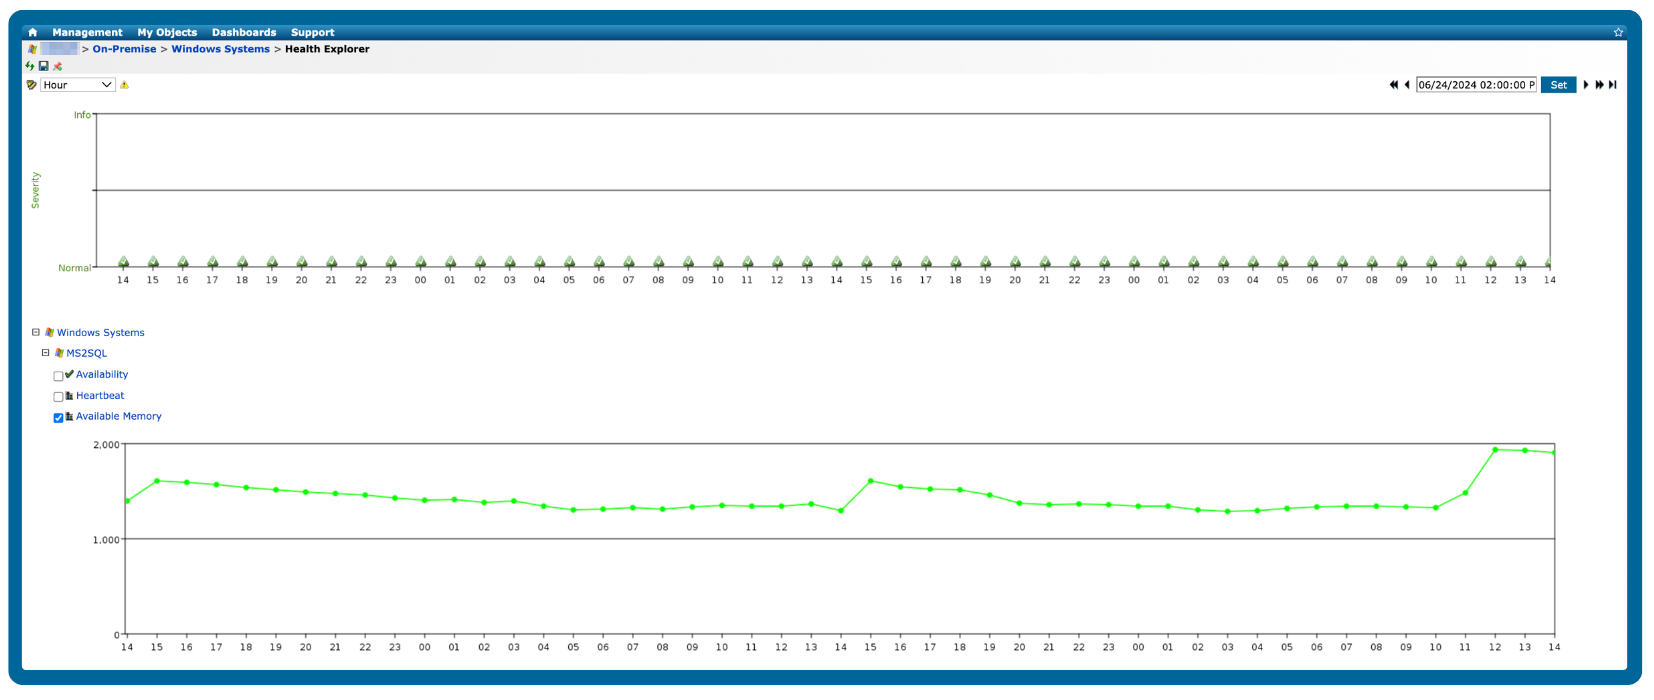
Accelerate issue resolution using time-synchronized data and troubleshooting context
By combining time-synchronized data and comprehensive troubleshooting context, you will gain a deep understanding of server behavior and performance patterns, enabling quick and effective problem-solving, and minimizing downtime efficiently.
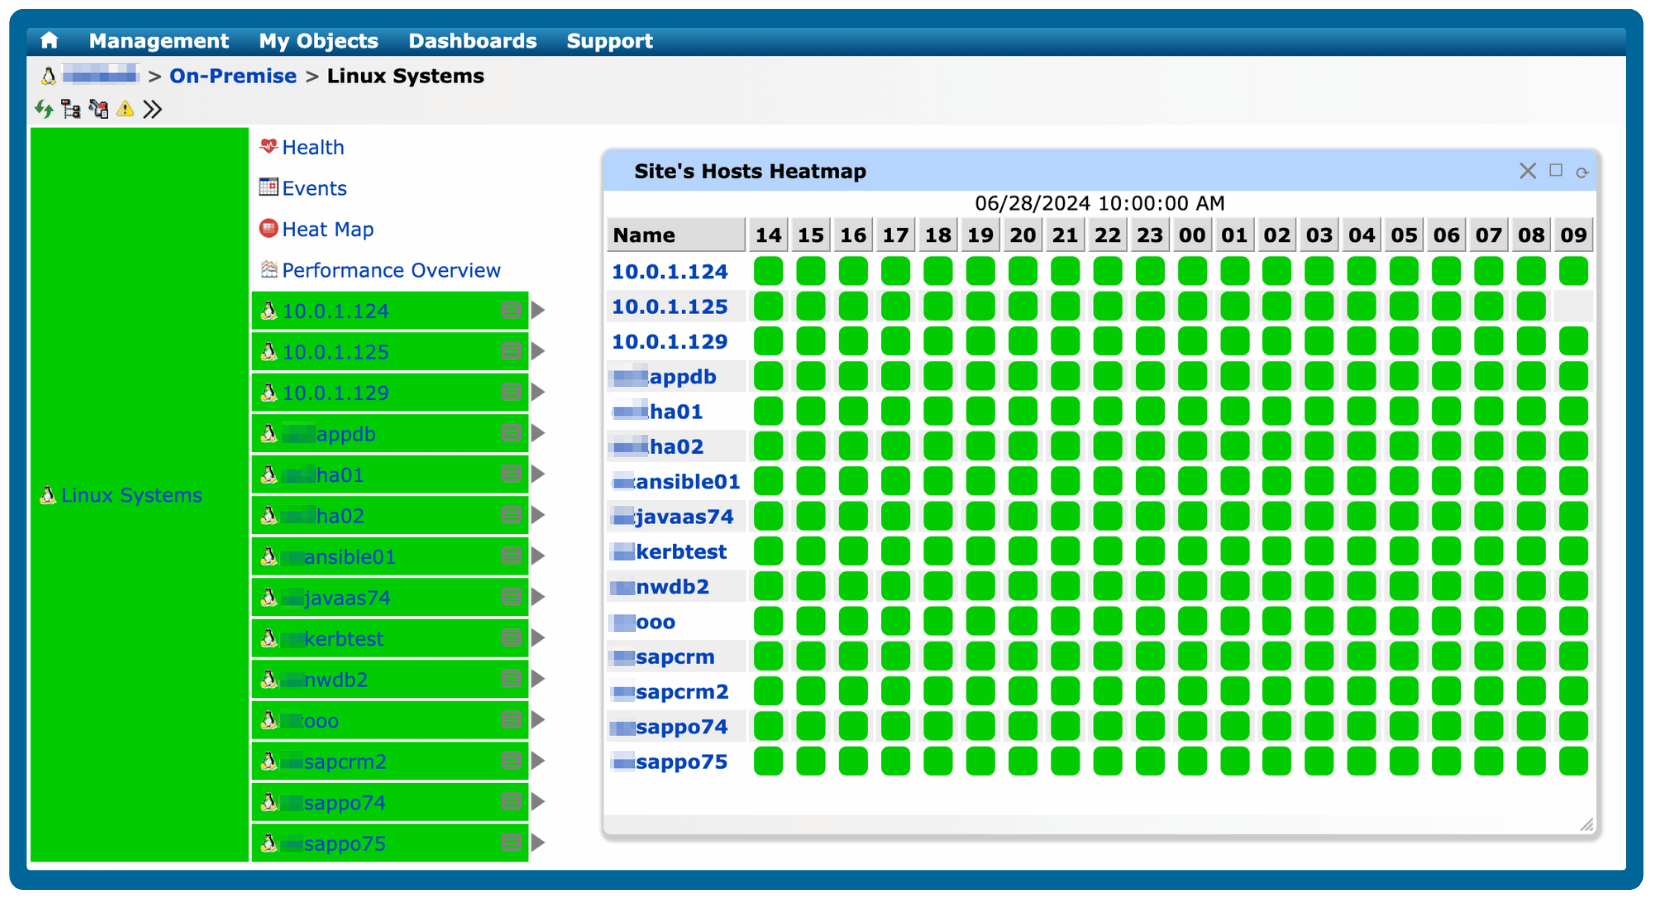
Visualize key metrics with real-time, color-coded heatmaps
Quickly identify performance bottlenecks with a color-coded heatmap that provides a concise overview of specific metrics that matter most to you. Stay ahead with real-time updates and monitor system performance as it happens!
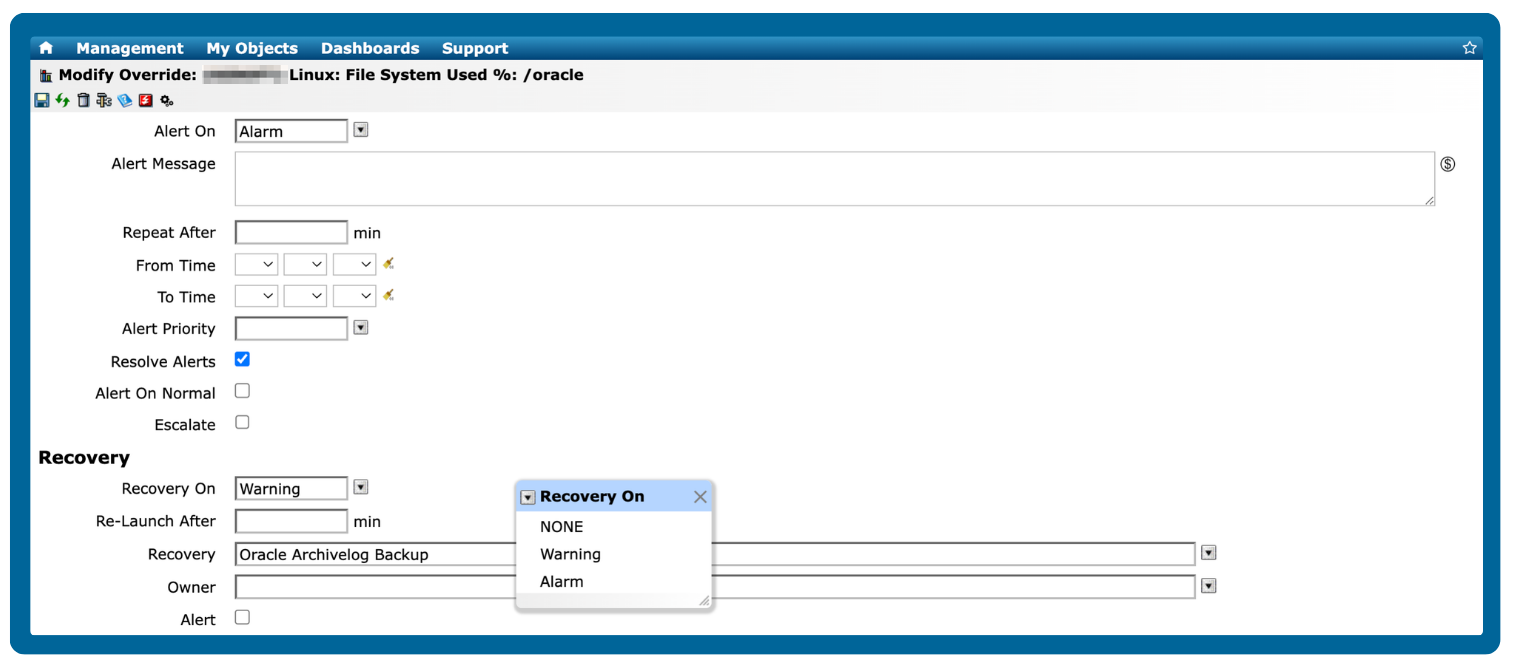
Trigger automated recovery actions using known fixes for common server issues
Gain access to a diverse set of pre-defined recovery actions designed to resolve common server issues, ensuring minimal disruption to operations quickly. You can also configure custom recovery actions for added flexibility.
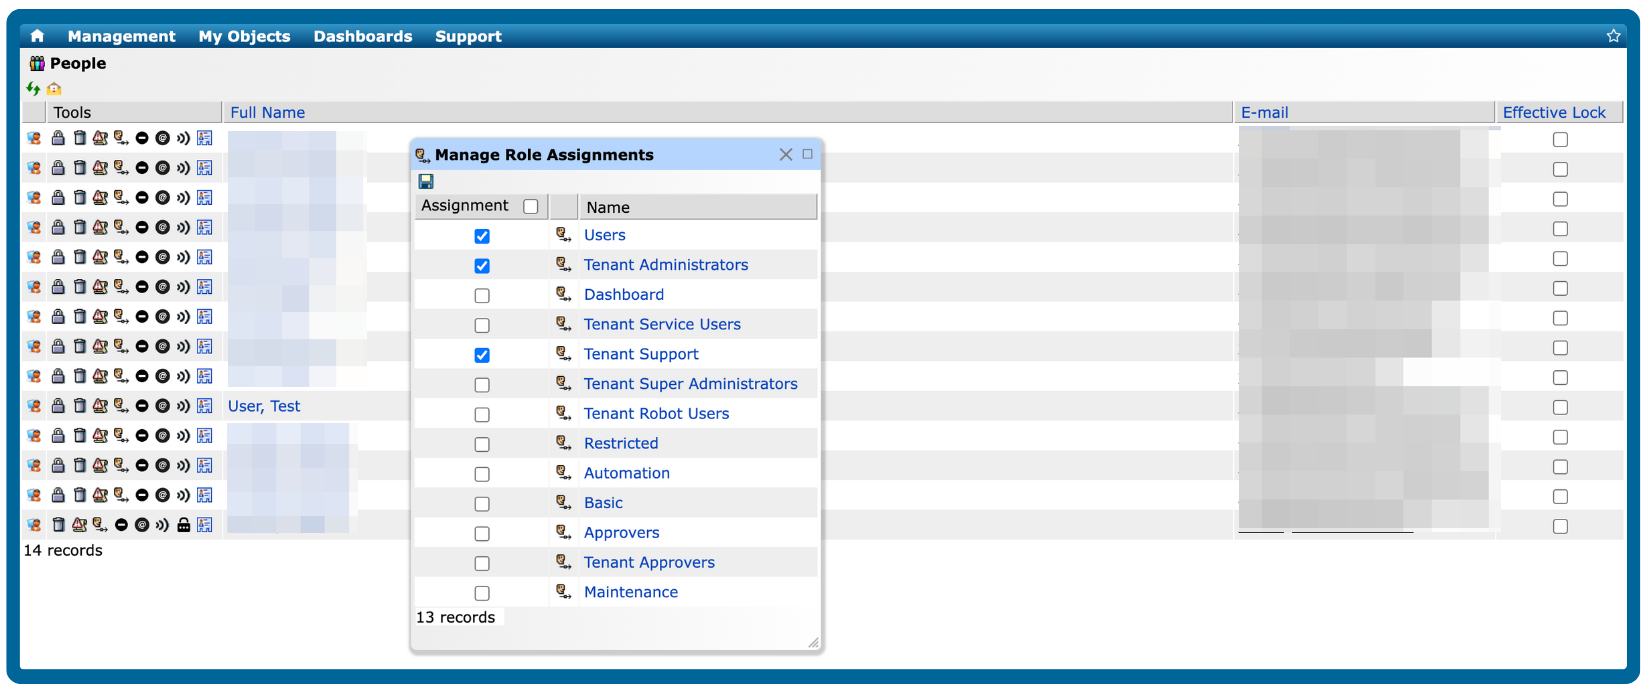
Simplified user access control management
Manage role assignments easily and ensure that only authorized users have access to the right tools and resources, maintaining security and operational efficiency.
Best Practices for Proactive Server Management
Taking a proactive approach to server management is more than just keeping systems up and running—it’s about creating a secure, reliable environment that supports your team and earns customer trust. By following proven best practices, organizations can prevent unexpected disruptions, enhance performance, and protect valuable data.
For several years now, IT-Conductor has been a proven solution for system monitoring, reporting, and automation of SAP IT operations at IDEXX. The team and platform have been a valuable part of our SAP journey to the cloud.
Trusted by leading brands worldwide

Frequently Asked Questions
What is server monitoring?
Monitoring servers means tracking the availability, performance, and resource utilization (CPU, memory, disk, network) across Windows and Linux environments so that your applications and services run smoothly.
What metrics should be monitored on a server?
Key server metrics to monitor include:
- CPU utilization – to track processing load and detect overuse or idle resources.
- Memory usage – to identify leaks or insufficient capacity.
- Disk I/O and storage utilization – to ensure read/write operations perform efficiently.
- Network throughput and latency – to detect bottlenecks or connectivity issues.
- Process and service health – to confirm critical applications and background services are running.
- System uptime and availability – to measure reliability and SLA compliance.
For application servers (such as SAP or database hosts), it’s also important to monitor application-level performance, queue backlogs, and response times to correlate infrastructure health with end-user experience.
How does agentless server monitoring work?
Agentless server monitoring works by collecting performance and availability data remotely, without installing software agents on each server. Instead, it uses standard protocols such as SSH (for Linux/Unix), WMI (for Windows), SNMP, or cloud APIs to securely retrieve metrics like CPU, memory, disk, and network utilization.
How to set alert thresholds for server performance issues?
Start by establishing baseline behavior for typical workloads (average CPU, memory, disk I/O, and network usage). Then configure thresholds just above those baselines, so that alerts trigger on sustained deviations rather than brief spikes. For example, trigger alerts when CPU usage exceeds 85% for a sustained period instead of short spikes.
How to monitor server health across multiple data centers or cloud regions?
You can monitor server health across multiple data centers or cloud regions by using a centralized, cloud-based monitoring platform that aggregates performance data from all environments in real time. This enables unified visibility across hybrid or multi-cloud setups, allowing teams to compare performance, detect anomalies, and automate responses regardless of where the servers are hosted.
How does server monitoring help with capacity planning?
By capturing performance metrics and resource-utilisation trends over time (CPU, memory, storage, network) you build historical insight that helps you identify under- or over-provisioned servers and anticipate future growth.
These insights help IT teams predict future resource needs, identify under- or over-provisioned servers, and plan upgrades or scaling before performance issues occur.
What are common causes of server performance degradation?
Common causes of server performance degradation include:
- Sustained high CPU or memory utilization
- Disk I/O bottlenecks
- Network latency or bandwidth congestion
- Resource contention between multiple applications on the same host
- Misconfigured services or system settings
- Outdated software or firmware
- Inefficient workloads (e.g., poorly optimized database queries)
In some cases, hardware failures or inefficient database queries further impact performance.
Continuous monitoring helps detect these issues early, allowing IT teams to take proactive measures before users experience downtime.
What's the best way to handle alert fatigue in server monitoring?
The best way to handle alert fatigue in server monitoring is to implement intelligent alerting and automation. This includes setting dynamic thresholds based on baselines rather than static limits, using correlation rules to suppress duplicate or dependent alerts, and prioritizing incidents based on severity and impact.