System Logging Protocol, widely known as Syslog, is a standard protocol that facilitates the sending of system logs or messages to a centralized location. Syslog messages provide a detailed view of what's happening on your systems at any given time, which is why it's important to have a Central Syslog Server that collects logs from all the nodes in your network.
However, monitoring Syslog messages is far beyond simply collecting logs. A good Syslog monitoring solution should allow you to see events as they happen, filter logs, and configure alerts so you can identify issues early on and take action before they become bigger problems.
Why Monitor Syslog Messages?
Modern systems and applications are far more complex now than they used to be. Especially in an environment with microservices-based applications, several services are running simultaneously, and interdependencies get complicated when one or more services fail. This makes it difficult for system administrators and application owners to assess system and application health. By monitoring Syslog messages, you will be able to understand your environment on a more granular level depending on what you want to see. This way, you will be able to detect potential issues before they become incidents.
Syslog messages can also be used when performing compliance audits. One of the most important audit requirements for SAP HANA security is to enable audit traces using Syslog (Reference: SAP Help Portal - Recommendations for Auditing). For instance, you have a compliance requirement to examine user activities for a particular system. You can utilize Syslog messages by filtering out the system that you need to investigate, searching through the logs by user, and identifying what activities can be considered authorized and unauthorized.

Figure 1: Syslog Server Query Results for “user”
Last but not the least, monitoring Syslog messages are helpful when troubleshooting system issues and performing RCAs (Root Cause Analysis). Let's say you encounter an alert telling you that a server is DOWN at a specific timestamp. You verified that the server is now UP and running but you want to know the reason why it went unavailable. You can check Syslog messages, and filter out activities relating to shutdowns, server startups, failed connections, and so on. These event logs should be able to help you in identifying what happened at that particular point in time.
Use Case: Syslog Monitoring for SAP HANA
To demonstrate how Syslog Monitoring works in IT-Conductor, let us consider the following scenario:
The SAP Basis administrator wants to know if a user has been deleted from any of their SAP HANA systems.
Pre-requisite Requirements
-
Follow the steps in SAP Note 2624117 to configure HANA Audit Log in Linux Syslog.
-
The security settings for “Auditing Status” should appear as Enabled and the “Audit Trail Target” should show Syslog (default).
-
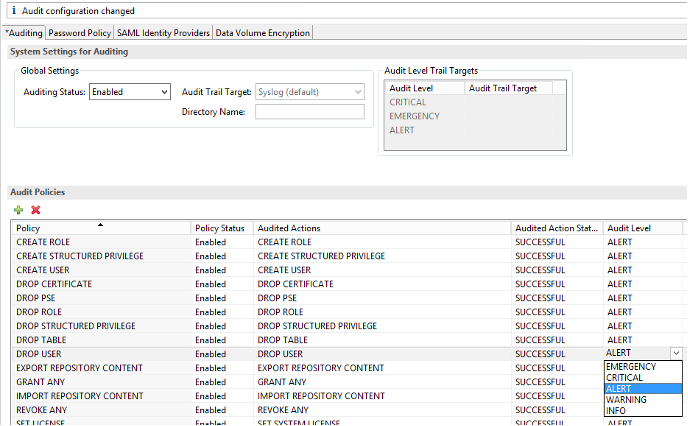
Create your own HANA Audit policies. The Audit Level assigned will be used as a reference by IT-Conductor to decide which Audit log entries will be reflected in the Central Syslog Server.
Below you can see that the DROP USER policy has been assigned an Audit Level of “ALERT”.
 Figure 2: Audit Policies for SAP HANA
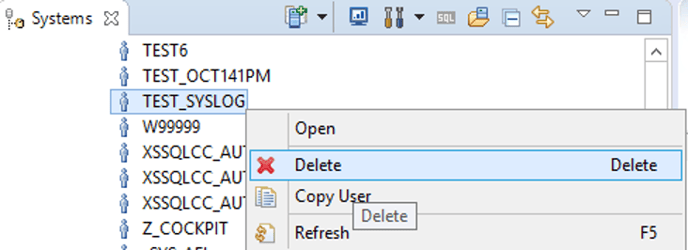
Now, let’s try deleting a HANA user.
 Figure 3: Deleting User in SAP HANA
 Once the user has been successfully deleted, this DROP USER action will be Audited and forwarded into /var/log/messages.
 Figure 4: Syslog Message in SAP HANA
How to View Syslog Messages in IT-Conductor
-
Navigate to Syslog Central > Syslog Search.
Figure 5: Syslog Central
2. In the “Message” text field, type in “DROP USER”. Then enter to search.
Figure 6: Syslog Server Query Results for “DROP USER”
With the Central Syslog Server capability, administrators can quickly filter and see all “DROP USER” statements executed for HANA systems connected to IT-Conductor.
3. Clicking on any of the resulting messages will give more details about a particular Syslog entry.
 Figure 7: Syslog Message Details
From the example above, you can see the timestamp on when the “DROP USER” event happened, the host from where it was executed, the Process ID, and the exact Syslog message reflected in /var/log/messages.
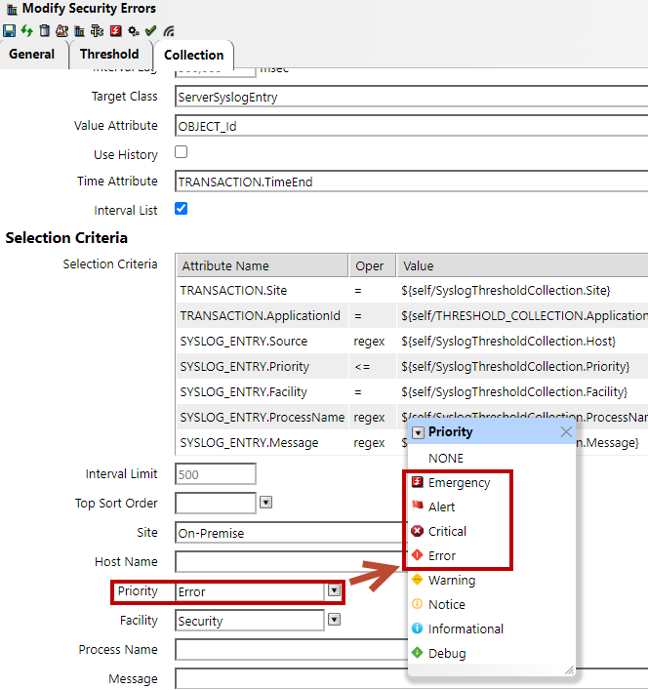
Not all Audit Policies, however, are enabled by default in IT-Conductor. Checking the Central Syslog Thresholds for Security Errors gives you the option on which level of Audit entries will be reflected in IT-Conductor.
From the example below, only alerts with priority (Audit Level) Error and above will be reflected in IT-Conductor.
 Figure 8: Syslog Priority (Audit Level)
Learn more about Central Syslog Server and how you can set up clients to send Syslog messages to IT-Conductor.