SAP HANA Monitoring
SAP Basis System Health Check
A performance monitoring service powered by IT-Conductor with expert SAP performance best practices, a valuable alternative to SAP Earlywatch services
Time-synchronized troubleshooting Performance Problems Using Performance Intelligence tool from IT-Conductor
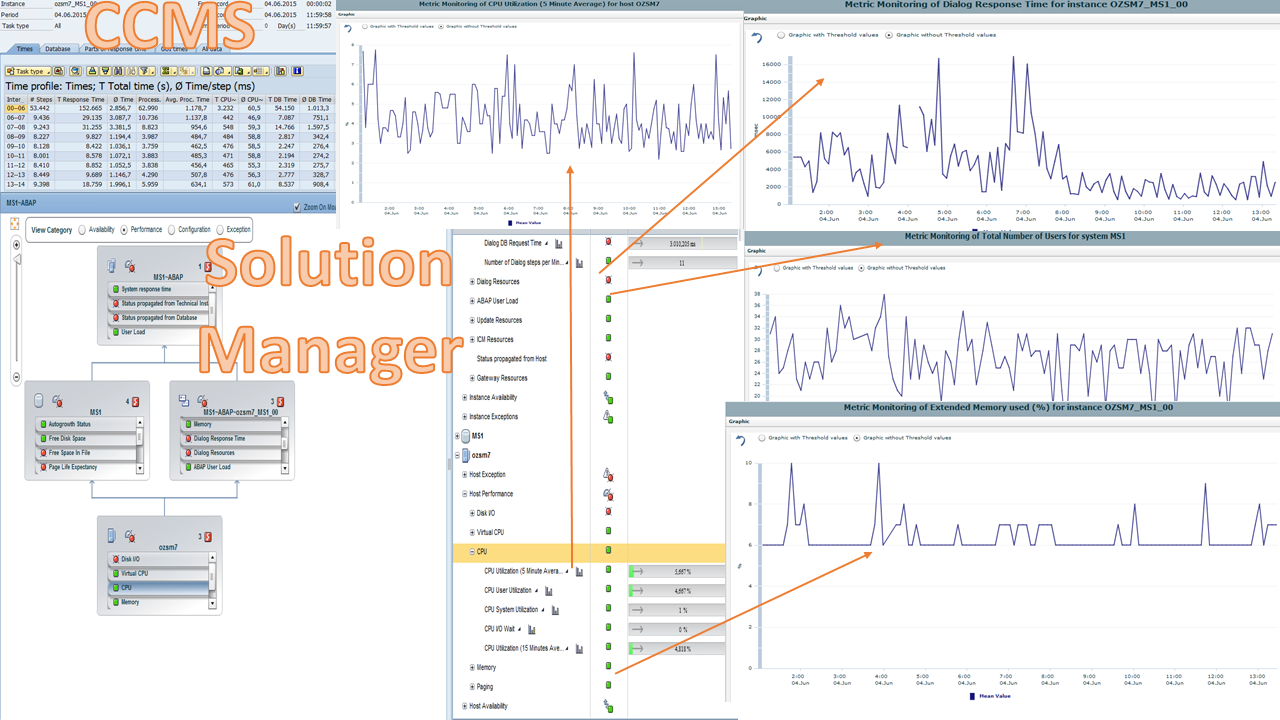
Users call and escalate about how bad their performance is and the team scrambles to troubleshoot for the root cause, but the subject matter experts are showing their various charts from their various tools on the incident call. The incident manager circles the room to prompt the Application team to the Basis team, to the DBA team, to the OS team, to the Storage team, and finally to the Network team, trying to see if someone knows the cause of the issues. Some think they found the culprit because their data has some spikes, but they are not quite sure because they don't know what else was happening on the system from other infrastructure or application components.
It may look something like these from CCMS and Solution Manager, which are just plain hard to analyze because they aren't aligned. The teams are most likely not able to agree with confidence on the root cause.
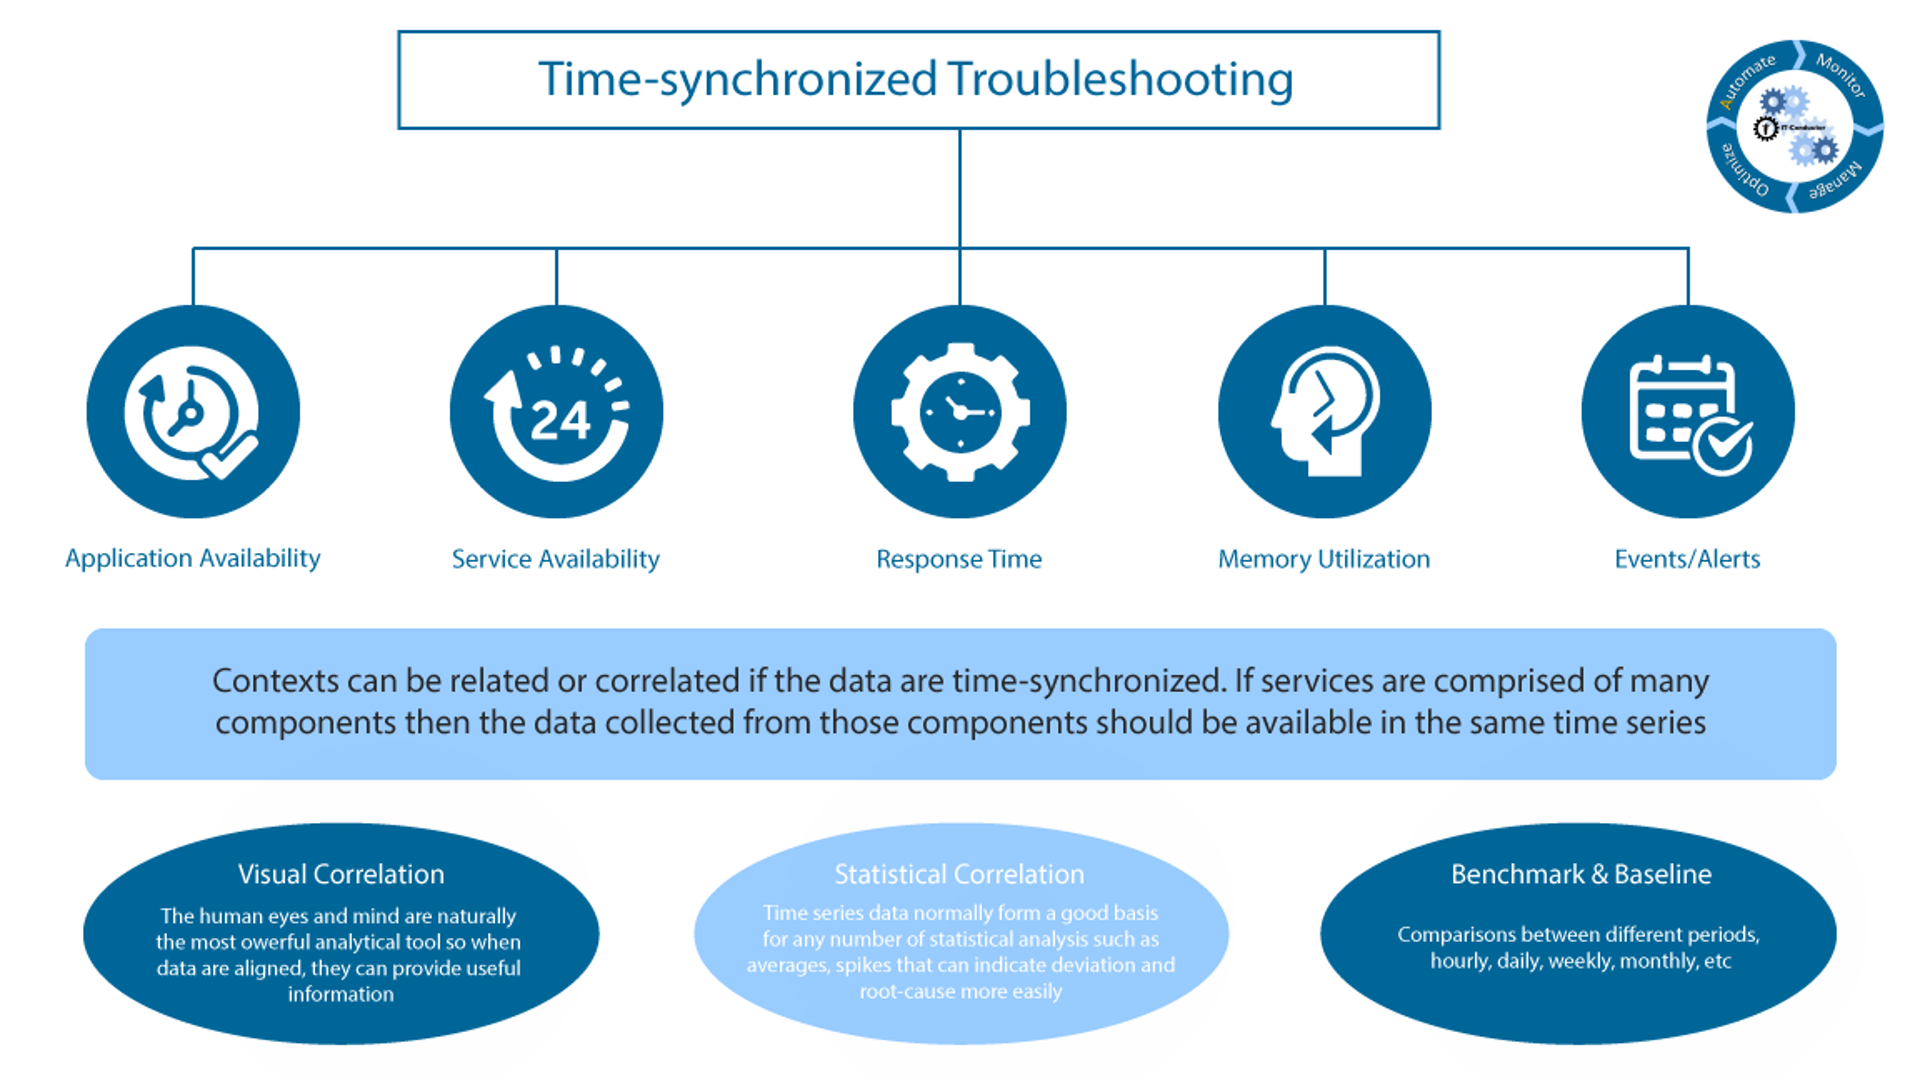
Effective and efficient troubleshooting requires contexts that are aligned where data including alerts and metrics are time-synchronized. If services are comprised of many technology components, then the data collected from those components should be available in the same time series to enable:
Here's an easy troubleshooting overview chart that includes the important KPI in one view, with options to drill in or add further troubleshooting context on the same chart, or compare different periods, and from a service monitoring standpoint.
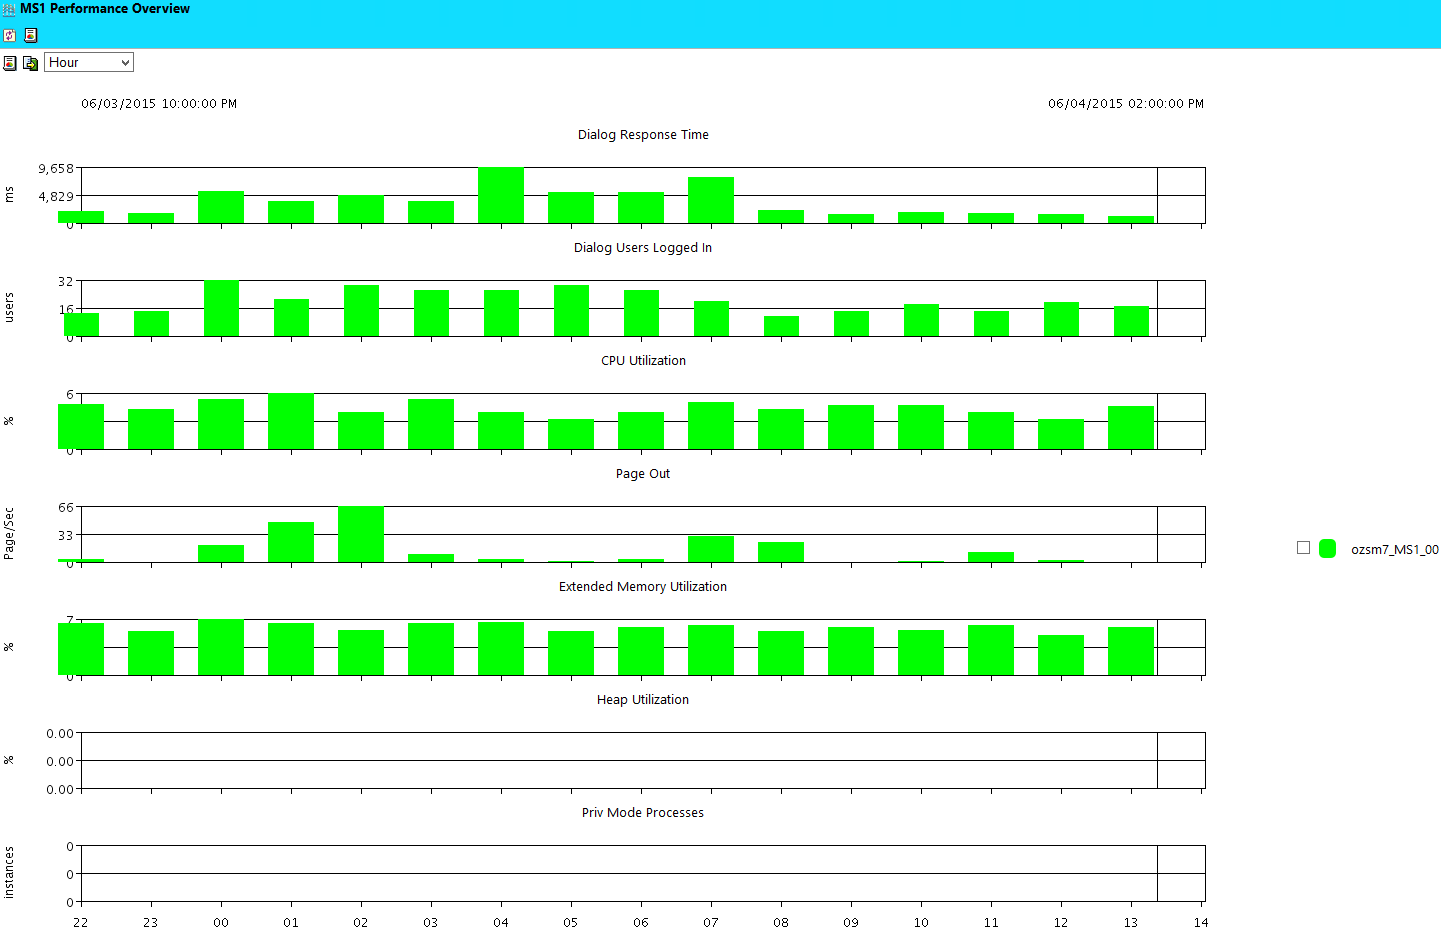
All synchronized! Want to see more?

A performance monitoring service powered by IT-Conductor with expert SAP performance best practices, a valuable alternative to SAP Earlywatch services
Impact of Long-running Transaction and Expensive SQL Analysis in performance.
SAP Performance Monitoring for Upgrade and Migration