SAP monitoring
IT-Conductor Latest Automation Features Q1-2021
Q1-2021 SAP Monitoring, Linux Hardware Inventory Report, Dynamic End-User Experience, Advanced Automation of SAP Failed Job Restart
An overview of the IT-Conductor IT Health dashboard, highlighting availability, performance, metrics, alerts with quick deep dive access to any application
In a previous post, we covered an overview of IT-Conductor's latest automation features, with a brief spotlight on the IT-Conductor Dashboard. This is one of the crucial tools in how we apply the core tenet of IT-Conductor: Minimize Noise > Maximize Performance and what it means to you.
Traditional proactive SAP monitoring involves manual checks on performance t-codes and ticking off items in a daily list. Solution Manager provides a periodic (usually monthly) overview of the system's performance compiled in an Early Watch Alert report. Over time, SAP has provided many metrics and ways to display performance data. Combining these features with a growing number of SAP systems directly affects operational hours spent on health checks, ultimately increasing TCO. Many organizations have their own approach to mitigate this: running scripts that send out health checks (which still need to be reviewed), or CCMS alerts.
Both automated health checks and CCMS alerts provide a wealth of performance data but require significant effort, experience, and skill in finding the right metrics, granularity, and thresholds for any organization. One company might be interested in their lock waits to prevent impacts on transactional performance, while another would be more interested in their critical chained batch jobs. Some would turn on everything and spend time making sense of all the noise.
It’s easy to fall into the trap of including a lot of metrics in a scripted health check or activating too many CCMS alerts, because let’s face it, there are many moving pieces in an SAP system. Many of the items in such checks are ignored in practice because of the sheer volume of info to digest. IT-Conductor adds a layer of automation over this to compile only relevant/critical checks into a one-glance dashboard. IT-Conductor's Dashboard is highly configurable to show only what is meaningful to you-effectively minimizing noise. This way, you have more time to spend on doing tasks that add more value.
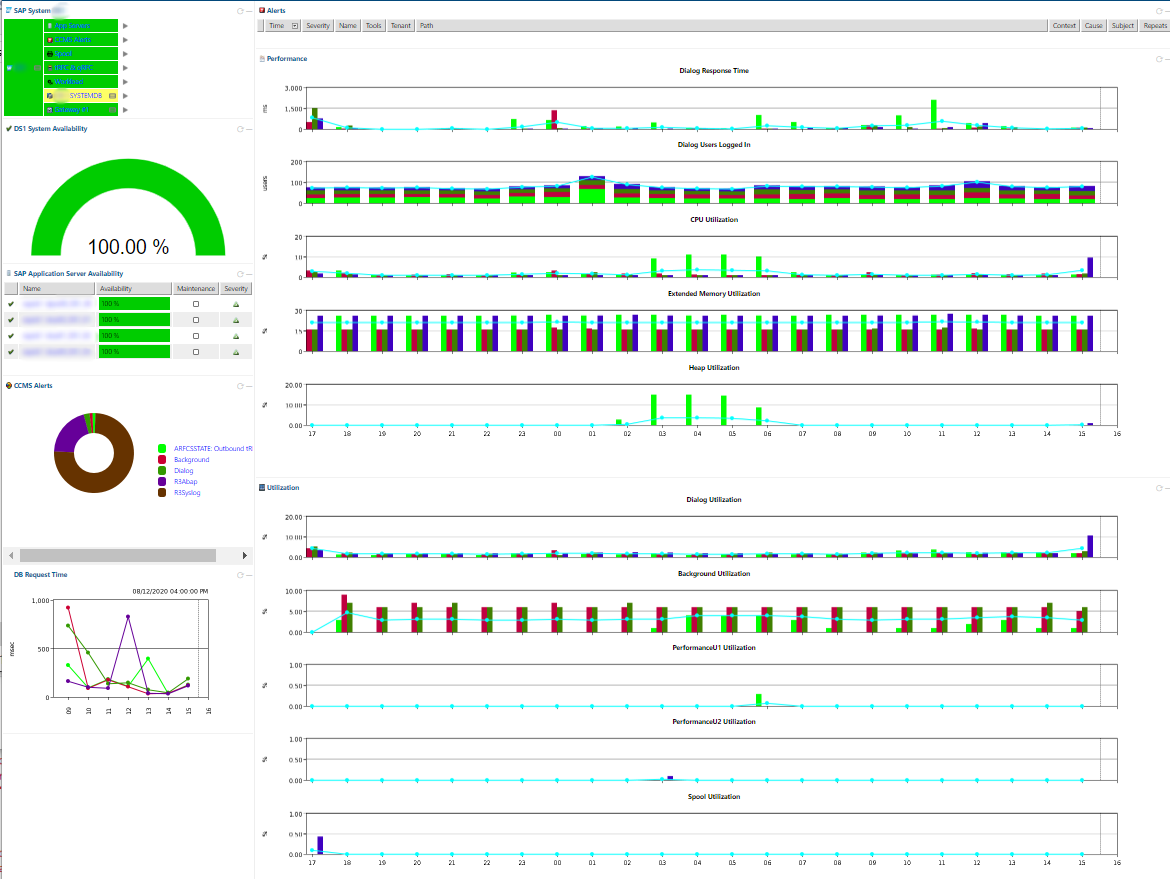
To drive this point, we will be briefly taking a look at a sample IT-Conductor dashboard (SIDs, hostnames censored). A metric that is always relevant would be availability, which is adapted in the sample below (Figure 1). For this scenario, any SAP performance issue was almost always caused by OS or Database issues based on the administrator's experience of how the organization uses its systems. Because of this, each production operating system and database's overall health was configured to be shown at one glance. Since then it has been much easier to pinpoint and nip potential issues at the bud after around 5 seconds of logging in and glancing at availability, OS level, and DB health. Of course, any SAP issues impacted by underlying dependent infrastructure components will also show an impact to the application, and a simple one-click will display that system’s dashboard (Figure 2).
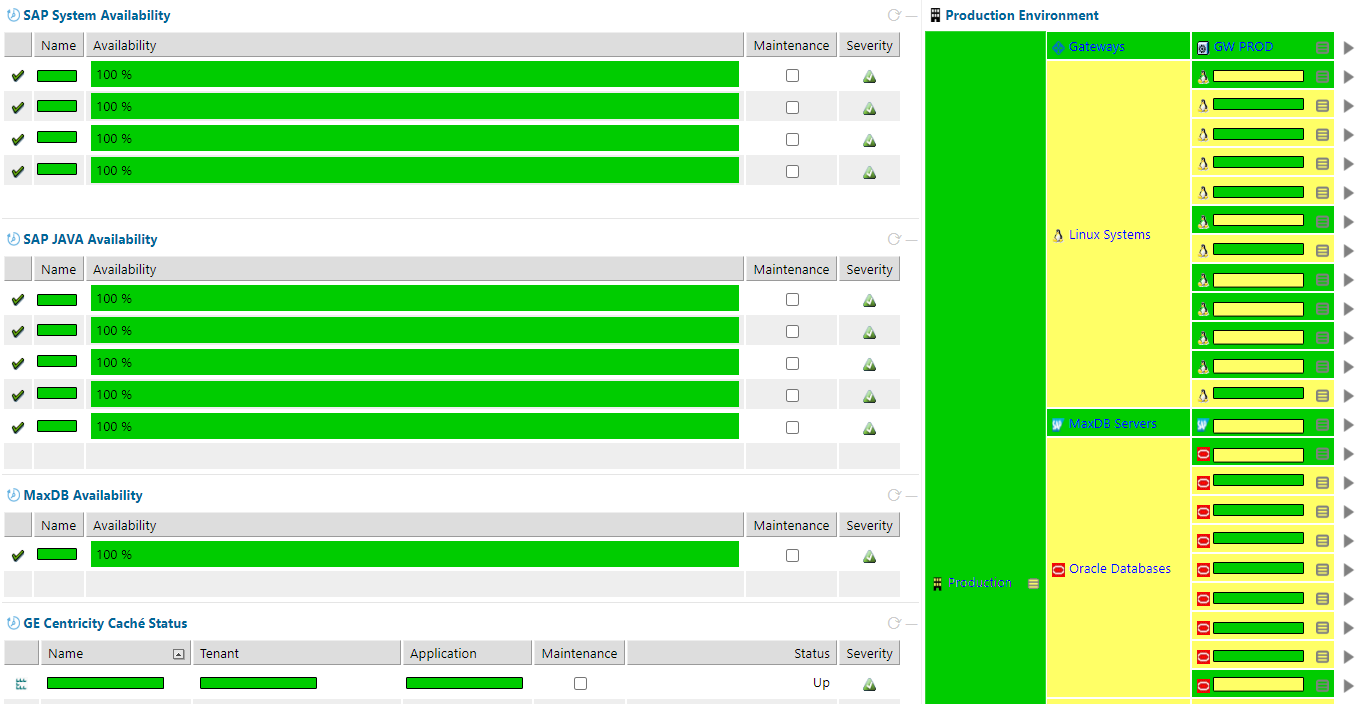
Figure 1: Tenant IT Health Dashboard
Here at IT-Conductor, we understand that everything changes, from requirements to system and user behavior that have an effect on performance. It is why the dashboard is not set in stone - you can always easily update the entries you see in your dashboard without the need for a Fiori/UX developer. Templates are provided initially, as well as guidance to empower you on how to make it your own SAP Administrator Dashboard.
IT-Conductor also allows you to keep everything centralized for your team - you can set up dashboards for other key people in your organization. Management and Command Center teams would be inclined to see availability, the platforms team would be interested in VMs, and DBAs would be happy to see their database's health.
If you think this is something worth bringing into your organization, let's talk, and we’d be happy to help you try it out by signing up with the button below.

Q1-2021 SAP Monitoring, Linux Hardware Inventory Report, Dynamic End-User Experience, Advanced Automation of SAP Failed Job Restart
IT-Conductor Latest SAP Monitoring Features Q1-2019
Welcome to the Q1 2026 edition of IT-Conductor’s innovations in service orchestration and automation.