Top-down service management involves App, DB, OS, and other infrastructure components, performed in a correlated fashion. Identifying performance bottlenecks promptly within the database is very critical for enterprise applications that heavily depend on OLTP or OLAP transactions. Proactive database performance monitoring will prevent incidences that can threaten the stability of your systems. It's imperative therefore to have an effective tool and automated process for monitoring the health of your systems to ensure the continuous availability and performance of mission-critical enterprise applications.
| DB Performance Analysis |
SAP |
IT-Conductor |
-
Optimizing database performance requires identifying bottlenecks and resolving detected issues before system performance degenerates.
-
Correlating significant metrics like response time, database activity such as sessions, expensive statements, and resource utilization are among the top KPIs to discover the main issues affecting system performance.
-
Service interference can be avoided by proactively monitoring the state of your database performance and taking preemptive steps to ensure uninterrupted system operations.
-
Obtaining the root cause of declining database performance on time involves the monitoring of events (Resource bottlenecks like exclusive locks, DB alert logs, DB network logs, etc.) that have occurred over a period of time to gain deep insight into the issues affecting system performance.
|
-
The database performance can be monitored in SAP using ST04 or DBACOCKPIT. The DBACOCKPIT is a graphical user interface (GUI) used to monitor memory usage, SQL request, total DB time, and other aspects of the database system landscape.
-
The HANA database can also be monitored using a variety of tools such as SAP Solution Manager, SAP HANA Studio, and the Database Administration (DBA) cockpit in SAP NetWeaver. SAP provides database mini-check scripts which are sometimes required to run ad-hoc reports on certain performances and utilization.
-
The health condition of your database can be determined by using the cockpit to view current metrics in the system. Historical metrics are also useful in examining the performance trends of your database over different time intervals which can help in identifying the root cause of poor system performance.
-
The challenge with most SAP tools is to correlate application workload and system resource utilization with DB bottlenecks.
|
-
IT-Conductor cloud solution enables Administrators to quickly discover the source of performance issues top-down (trends) as well as bottom-up (events) in their applications using predefined thresholds, alerts, and reports, all without software and agents.
-
Monitoring your entire system environment with IT-Conductor can help you proactively monitor your system health and quickly detect trends before they become problems.
-
IT-Conductor supports full automation of SAP mini-check reports, or any SQL, on-demand or scheduled, and can issue recovery actions based on preset monitoring thresholds, such as HANA garbage cleanup, and archive log backups.
-
IT-Conductor provides useful insights into database performance across a wide-scale and heterogeneous system landscape, using a single pane of glass for all SAP-supported RDBMS platforms
-
Top DB monitors include buffers, space, IO, Process, Threads, CPU, Top SQL, DB Alerts, Backups, Resource limits
-
Accelerate application performance by leveraging on the insights provided by IT-Conductor into core system challenges.
-
Obtain correlated performance status across your system environment on a single dashboard.
-
IT-Conductor Trusted Advisor team can also provide remote DBA experts to help with DB analysis and best practices combining tools, processes, and people expertise.
|

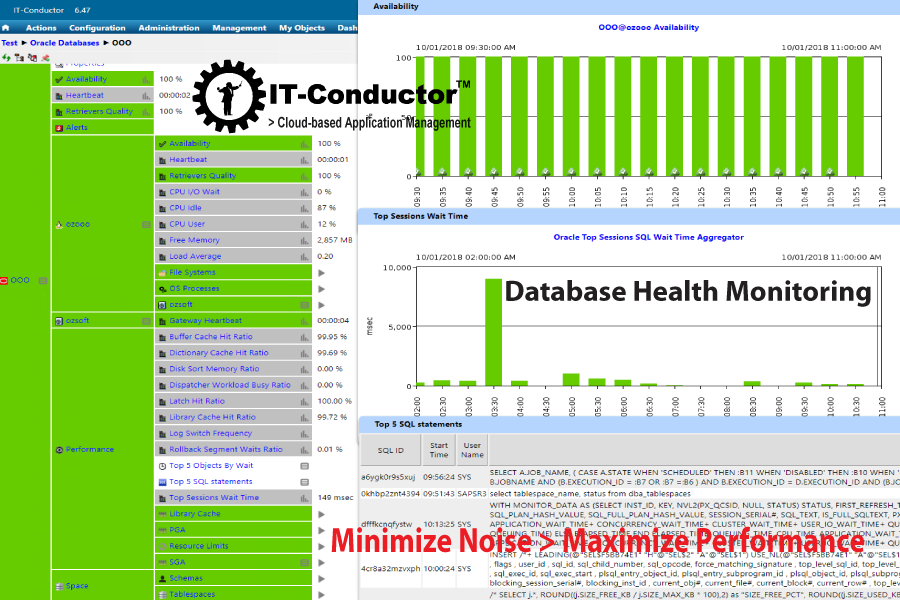
Figure 1: IT-Conductor SAP Basis - DB Monitoring
|