Performance monitor
Monitor SAP KPIs Across Multiple Systems Simultaneously
Time synchronized SAP monitoring of a set of KPI's across multiple systems or infrastructure components simultaneously
End-user experience is changing how organizations define success. Knowing how to monitor and make sense of it will help you make better business decisions.
End-user experience is changing how organizations define success. Knowing how to monitor and make sense of end-user experience data will help you make better business decisions.
In today’s technology-driven world, we use various platforms to execute business transactions. With large organizations spanning across different continents, managing systems and processes has become a challenge. This makes it more difficult to gather end-user experience data and analyze them to suit future developments and improvements.Over the years, organizations have taken advantage of different tools to provide better service. However, having a clear understanding of how things are performing across different environments is becoming more difficult for both administrators and business leaders. By monitoring end-user experience, organizations will have a deeper insight into how enterprise applications and distributed systems are performing from the customer’s perspective.
1. End-User Experience Monitoring: The Neglected Metric in SLAs
2. Ensuring Effective Execution of Business Processes in SAP
3. SAP End-User Experience Monitoring with IT-Conductor
4. Use Case: Location-based HTTP Response Time Monitoring (for Fiori users)
5. Implementation: Using IT-Conductor Object Groups
6. Analysis: How Response Time Affects End-User Experience
7. Facing the Challenge to Improve End-User Experience with IT-Conductor
End-user experience monitoring is one of the key metrics that is often neglected by organizations when dealing with service-level agreements. While experience can be subjective, success factors are highly attributed to how end users make use of the applications and how these applications provide support as they process business transactions.
Predominantly, service level management involves defining, documenting, monitoring, measuring, reporting, and reviewing the different service levels of the IT services agreed upon between the business and its customers. By keeping an eye on the interactions between the users and the different applications, administrators can easily recognize issues, proactively remediate them, and lower down mean time to repair (MTTR). This way, the business can provide better service to its customers and significantly improve end-user experience.
Unlike traditional SLAs, the focus should now shift to providing an excellent customer experience instead of meeting the agreed-on service level.
In SAP systems, one way to ensure the effective execution of business processes is to evaluate and report the availability and performance of all its components. The need for an operating cadence is also highly desired because it keeps all involved entities aligned with business objectives, priorities, and long-term goals. Knowing all these success factors is important in ensuring the reliability of systems to carry out business processes successfully.
SAP has built-in mechanisms conveniently put in place to collect various end-user experience data. However, making sense of it requires additional processing and engineering, especially when probing Fiori web users' response times for specific groups of people. Given this challenge, implementing a comprehensive solution, that can monitor applications and give visibility to how end users interact with the applications, should be at the top of every organization’s business priorities.
IT-Conductor is an application performance management (APM) tool that has the capability to monitor SAP systems and has a 360-degree view of the whole application environment. With our industry experts having over 20 years of experience, we understand the struggles of organizations when it comes to troubleshooting and preventing performance issues in a timely manner.
Monitoring end-user experience is no different. With IT-Conductor’s ability to oversee availability and performance, orchestrate different systems and environments, and automate complex IT processes, end-user experience monitoring is just a piece of cake.
To fully appreciate the value of end-user experience monitoring, let’s take a closer look at this use case scenario that is faced by IT administrators managing complex environments across multiple locations.
One of the hurdles multinational organizations face is long response times when using or accessing applications. Considering several factors that may be the cause behind this situation, troubleshooting may take several hours to days. Worst, some organizations suffer slowness for months, even years! It can be a nightmare for you as a business if you don’t address it in the shortest time possible.
Response time monitoring can help you in performing root cause analysis as to why you are experiencing long response times. By determining how fast or slow a particular resource responds to a query, you can examine the relationship between the different locations to isolate the issue.
In this scenario, a customer is using VPN to access the data center in California. While using SAP CRM via a Web UI, the customer experienced slowness in the performance of the application. After some time, users in certain locations started complaining about the same issue. As the SAP administrator, you’ll probably go straight to the network team but if you have visibility into how users are interacting with the application, you can have a deep dive into what may be the possible causes of the application performance issue. As for the management, having a dashboard to look at is something that can help you proactively take action before issues even occur. Reports can even be customized and configured to be sent directly to your e-mail on a daily basis!
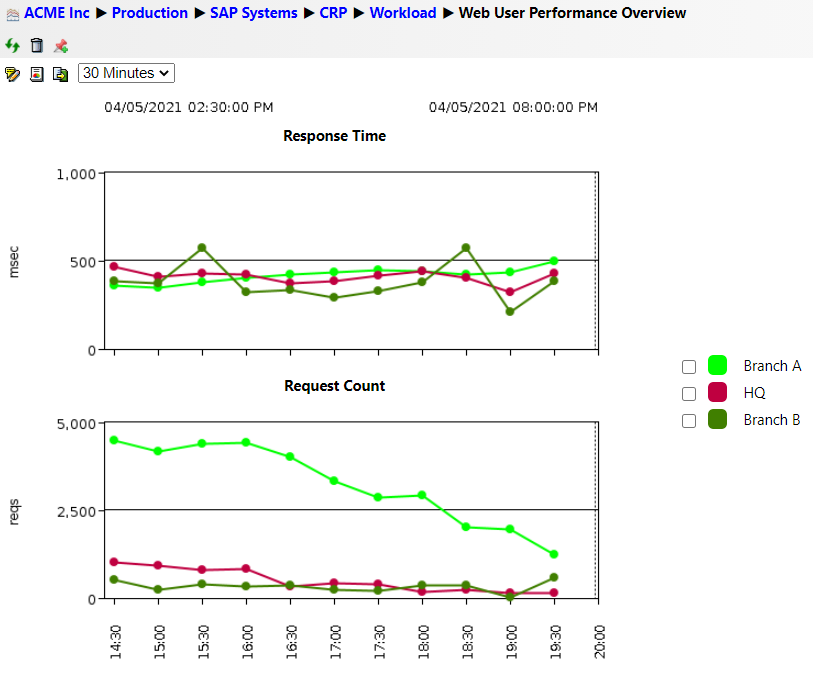
Figure 1: Web User Performance Overview in IT-Conductor
Drilling into response time data points to get a list of actual user’s response times:
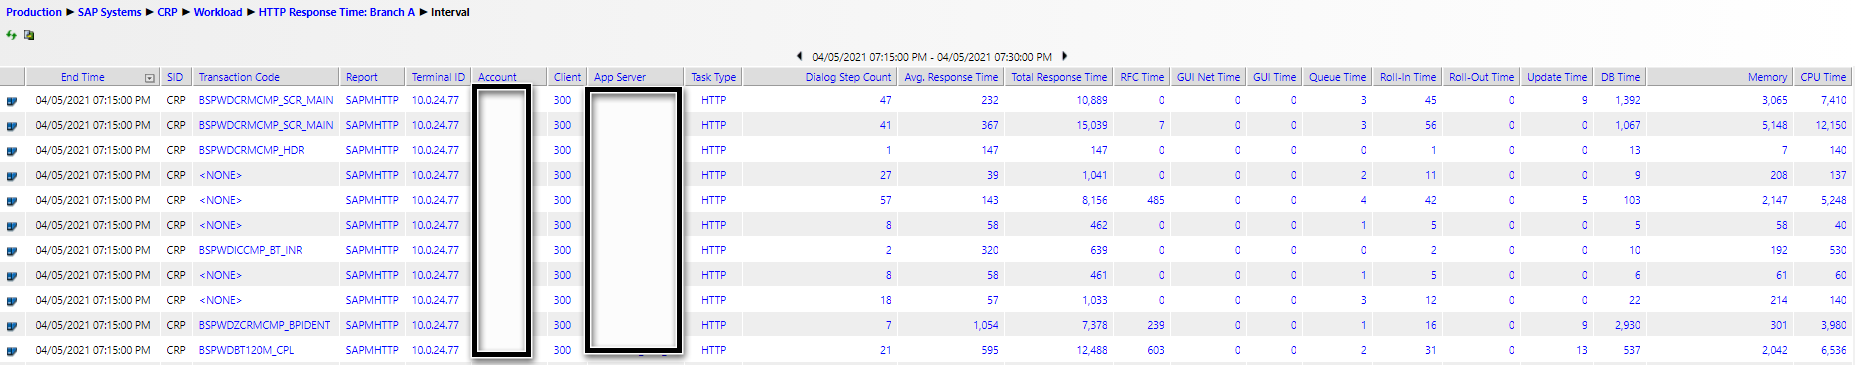
Figure 2: Sample User Response Time Data Points in IT-Conductor
Given this particular scenario, it would be a challenge to troubleshoot the application performance issue because SAP lacks a clear location attribute. Aside from the address where the user is located, there’s no way for you to easily derive the user's location in SAP.
This is why we came up with a new functionality in the tool to group users into object groups. The following steps will show you how it is possible through IT-Conductor.
1. SAP Systems are already monitored by IT-Conductor. You just need to add a collection of workload (STATS) and data targeting HTTP/s task types. In the image below, we’ve added a STAT summary retriever for all users and task types HTTP, and HTTPS (101,102).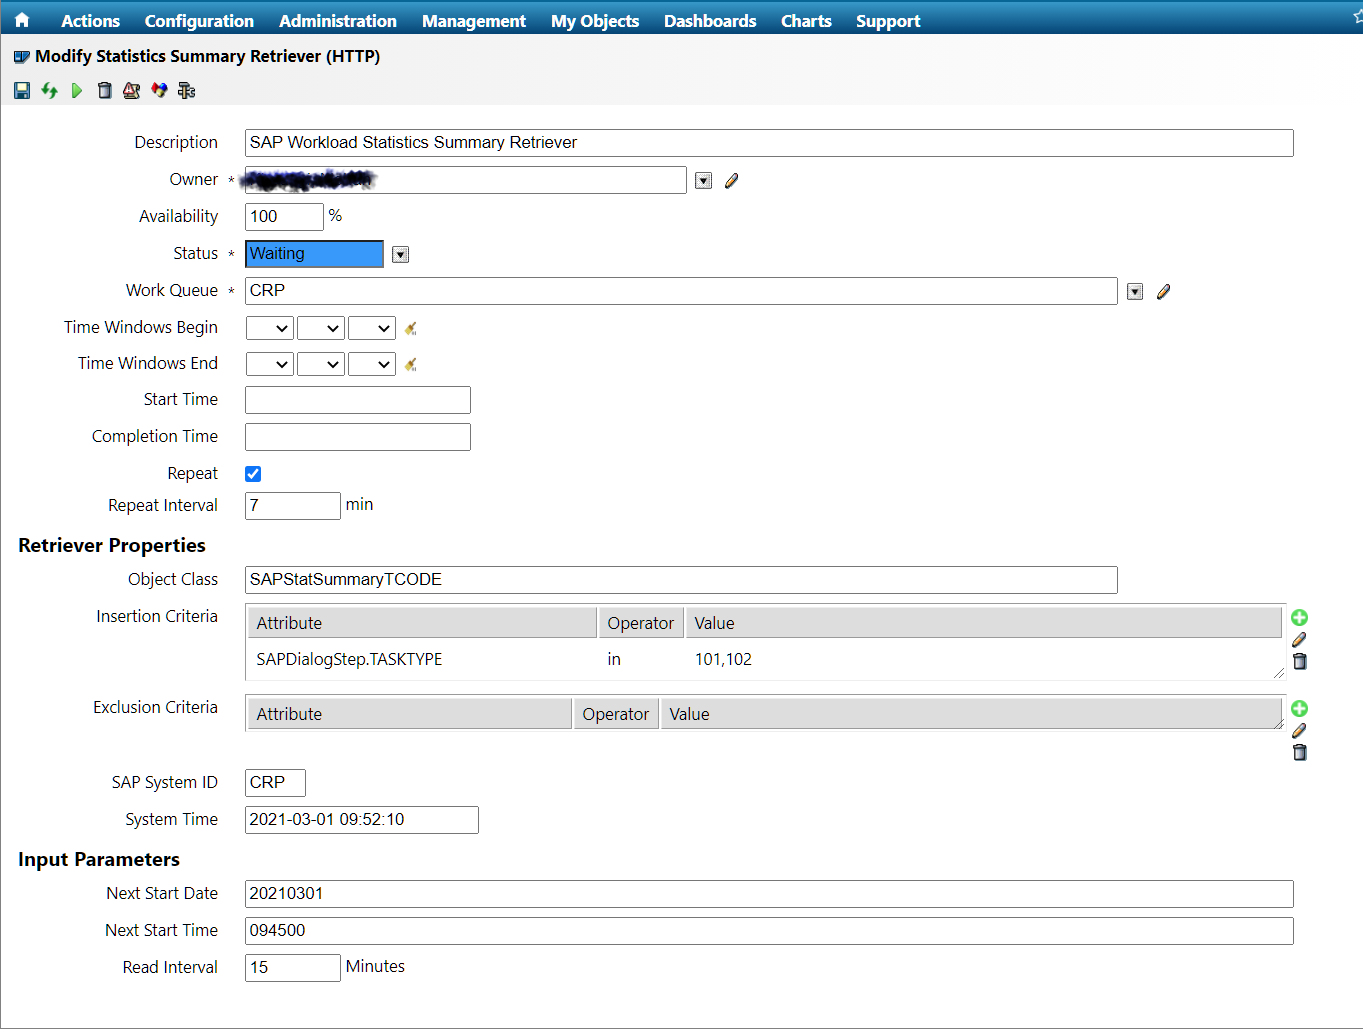
Figure 3: Statistics Summary Retriever (HTTP) Settings in IT-Conductor
2. Determine SAP User locations
a. SAP lacks clear location attributes aside from address. So, you need to establish SAP “Location“ Groups as locations and assign users to proper groups.
b. Pull SAP Users per group and associate to IT-Conductor Object Group.
i. Defined Group User Retrievers
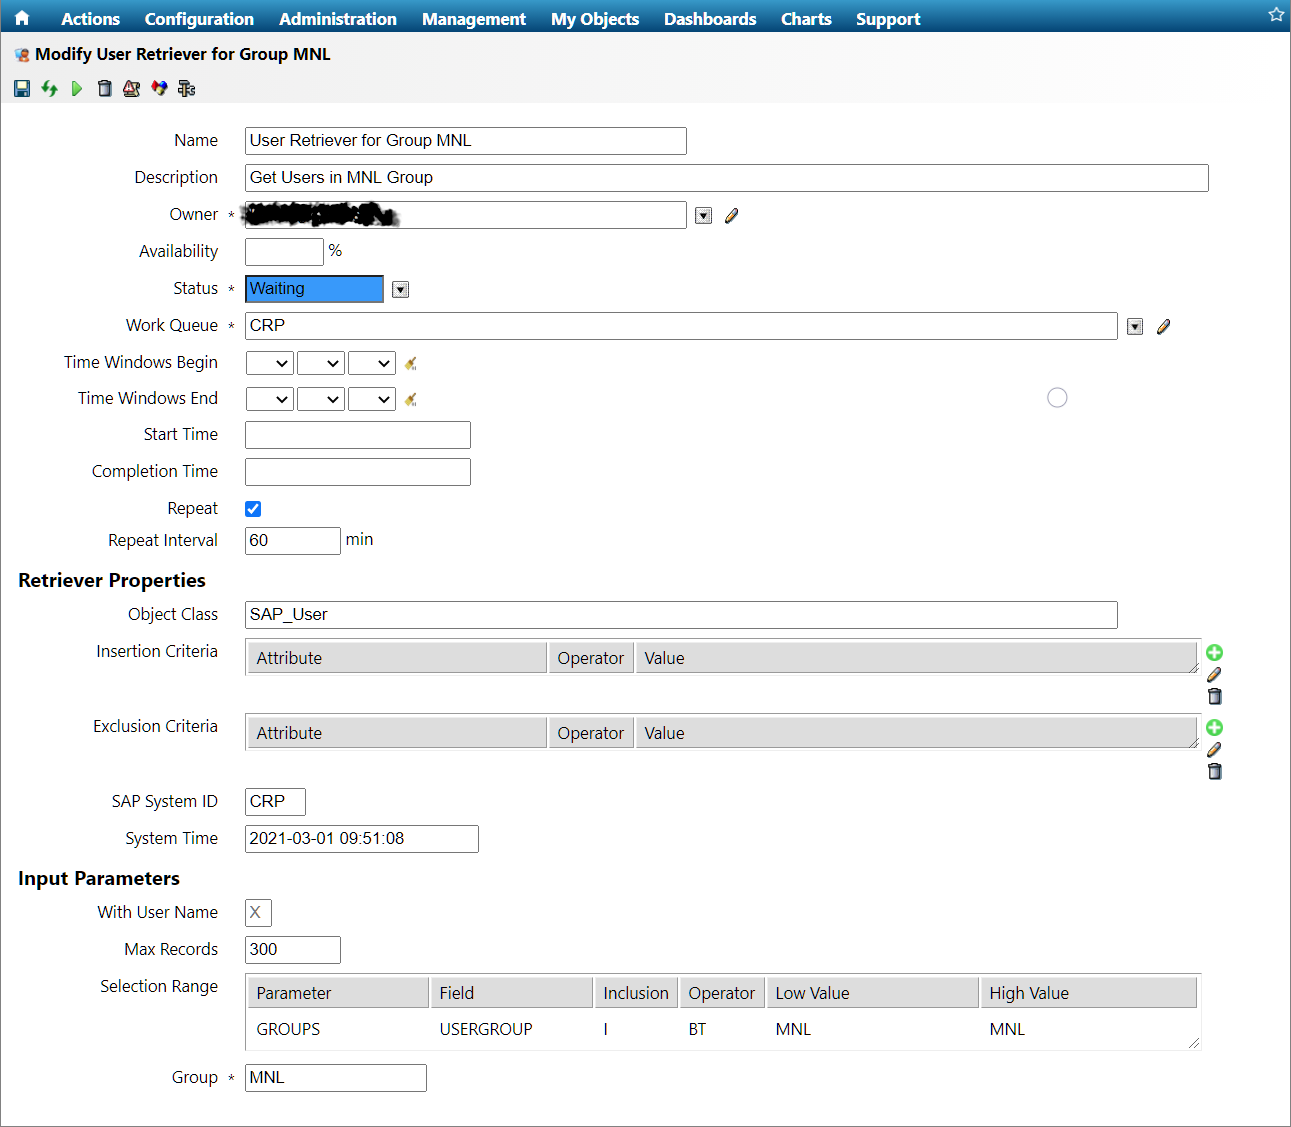
Figure 4: Group User Retriever Settings in IT-Conductor
ii. Defined dynamic Object Group SAP-CRP-MNL-Users (Tenant Object Menu>Object Groups)
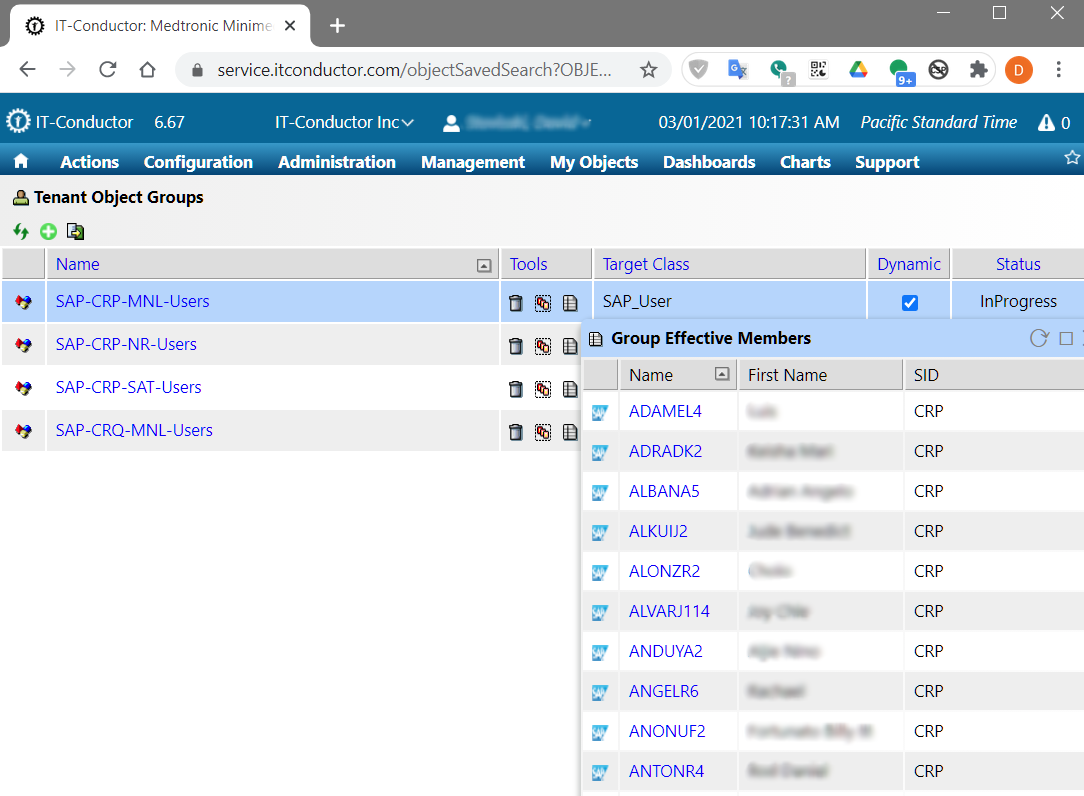
Figure 5: Tenant Object Groups in IT-Conductor
3. Define Object Group-based Monitors
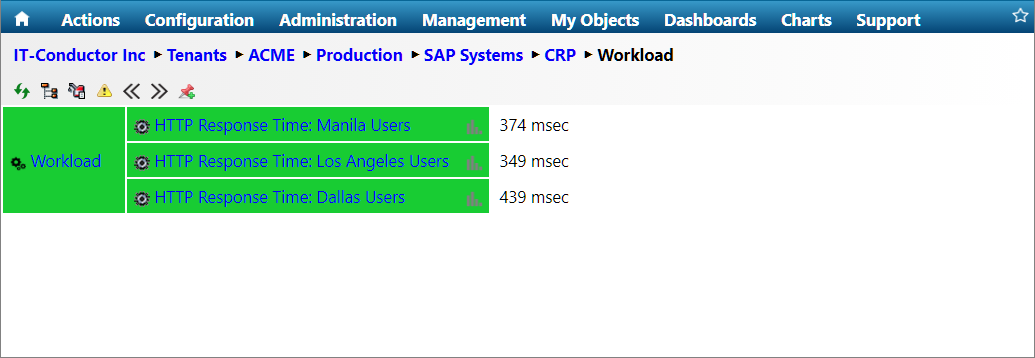
Figure 6: Object Group-based Monitor in IT-Conductor
a. Monitor Definition
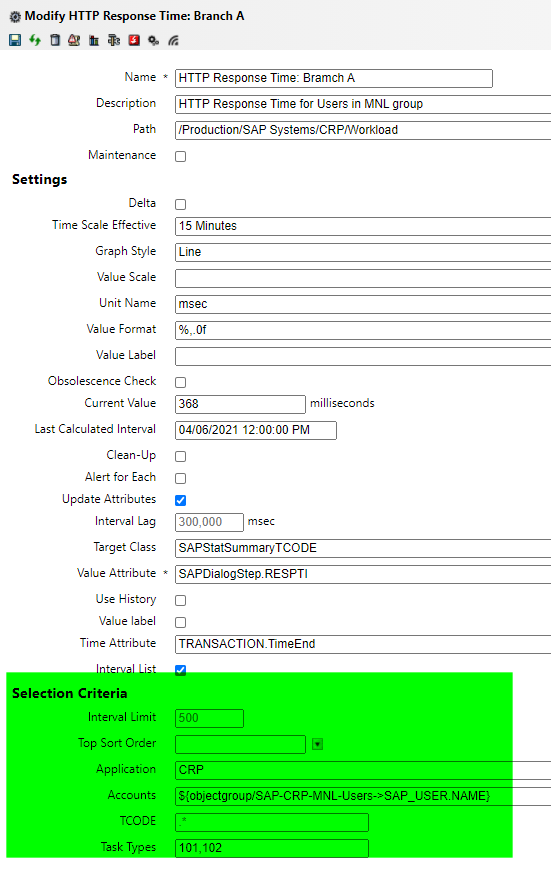
Figure 7: IT-Conductor Monitor Settings for HTTP Response Times with Dynamic User Group
See the Accounts field using ${objectgroup/SAP-CRP-MNL-Users->SAP_USER.NAME} This is a special variable that allows access to the object group members list (normally returns a list of Object IDs, “-><Attr Name>” returns the values of object attribute instead).
b. Results
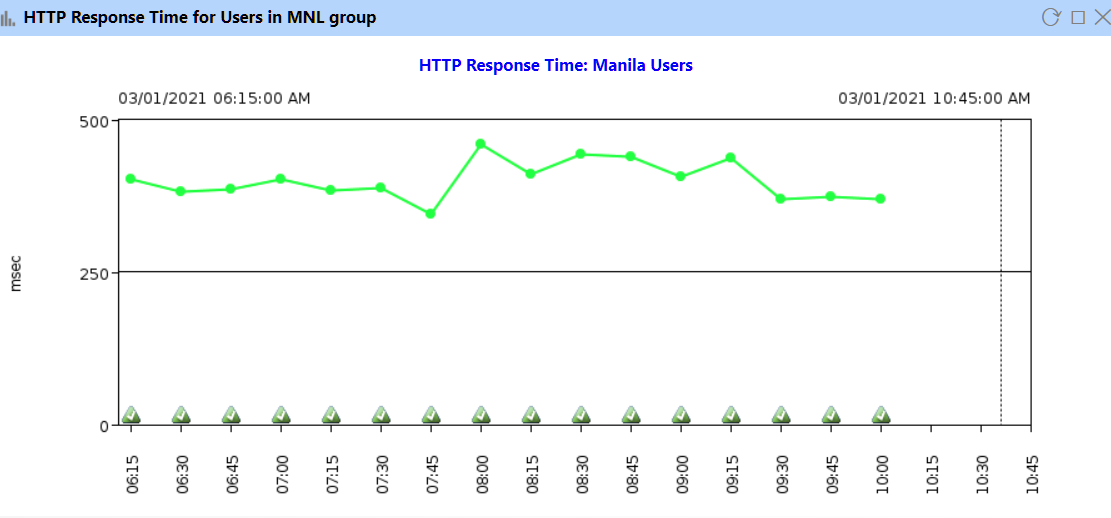
Figure 8: Sample HTTP Response Time Chart in IT-Conductor
c. Create an Override to perform alerting
d. If required, create a Report and then associate it with a schedule for periodic execution.
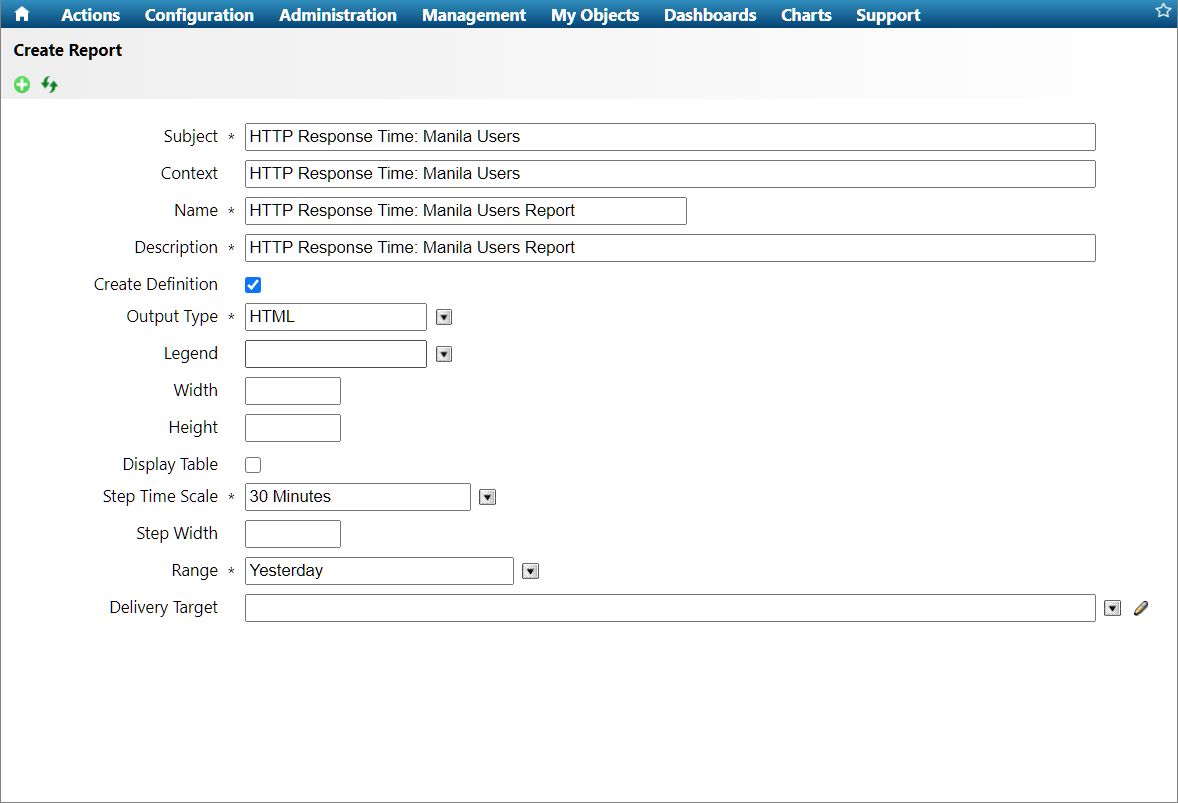
Figure 9: Create Report Window in IT-Conductor
Network latency time is directly proportional to the distance between the user and the server or the resource it is trying to access. This means that the farther the distance is between the user and the server (or resource), the longer it would take for packets to travel back and forth.
To optimize the end-user experience, you need to identify the user locations and where the SAP servers are hosted. Suppose the users are experiencing longer response times to a specific location. In that case, it is recommended to test the response time to the other locations and use the location with the lower response time. Ideally, the location closest to the user is the preferred server (or resource) that should be accessed for a better user experience.
End-to-end response times include network latency and SAP’s response time components (such as CPU processing time, database request times, wait times, RFC times, etc.). Therefore, the ability to overlay the end-user response times to other system component metrics in a time-synchronized manner is an absolute necessity to find the root causes of performance-related issues. This is where IT-Conductor’s Health Explorer and KPI deliver either on the dashboard interactively or through automated reports at scheduled times.
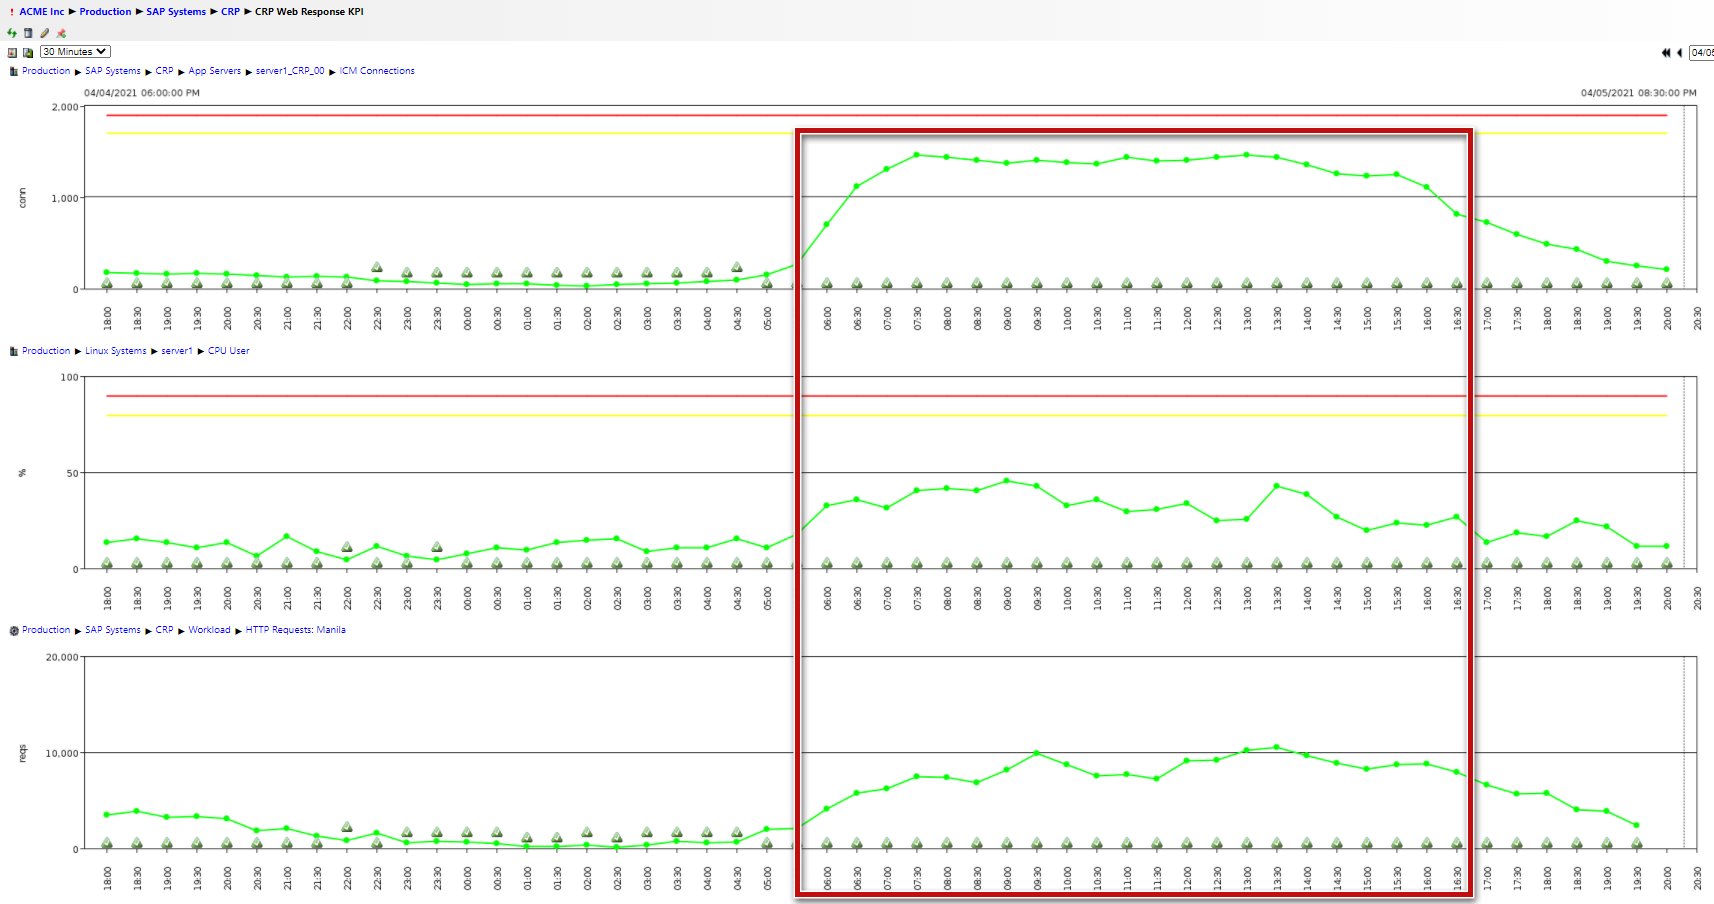
Figure 10: Sample CRP Web Response KPI in IT-Conductor
Poor end-user experience significantly contributes to reduced productivity among users. The problem doesn’t end there. Organizations invest large amounts of money deploying different applications only to have them underutilized, or worse, decommissioned even at the early stages of their lifecycle.
Knowing how end users interact with the applications, whether they may be internal or external, can help you improve their experience, increase competitive advantage, and decrease the risk of revenue loss.
As you employ an end-user experience monitoring system in your business processes, you should be able to recognize what functions poorly, find out issues, and decide where to improve. In turn, it helps you to provide users with a quality experience as it affects their day-to-day interactions with the applications they use to process business transactions.
Indeed, monitoring end-user experience is easier said than done. But monitoring end-user experience with IT-Conductor is easier.
All users expect nothing but fast, efficient, and worry-free service that your business can easily provide with the right tools.
Quality end-user experience matters. Make it your goal by integrating an end-user experience monitoring tool in your organization.
If you want to know more, feel free to schedule a demo with us.

Time synchronized SAP monitoring of a set of KPI's across multiple systems or infrastructure components simultaneously
Who is Monitoring SAP Solution Manager's Performance and Availability when SAP makes it the backbone of SAP landscapes?
SAP Monitoring by IT-Conductor with powerful features that saves customers up to 90% of time and cost