BOBJ
SAP SolMan Monitoring of BOBJ - Part 3 of 3 (Managed System)
SAP Solution Manager Technical Monitoring of BOBJ BI 4.0 - Part 3 of 3 (Managed System Configuration)
Discover how to leverage IT-Conductor to monitor the technical components of your SAP landscape and identify issues before they impact your business.
Over the last week, we've been busy updating our SAP Solution Manager 7.1 from SPS11 to SPS12. It doesn't sound like much but as usual, we found so many notes, preparations, and post-processing to perform. It's a whole lot more than just running SUM (Software Update Manager), so it will have to be a topic of discussion for another time.

Jump forward a week, and after hours of re-executing SOLMAN_SETUP phases for System Preparation, Basic Configuration, Managed Systems Configuration, and finally Technical Monitoring we were able to see some monitoring.
Below is a quick video overview of what's in SAP Solution Manager's Technical Monitoring capabilities.
SAP's MAI (Monitoring and Alerting Infrastructure) simplified the monitoring views into categories including Availability, Performance, Configuration, and Exception as seen below. After drilling in, there are metrics and charts that could be displayed (Adobe Flash rendered), but the exceptions and alerts for categories such as ABAP dumps, Syslogs, and batch jobs only show total alerts in the last hour, day, etc. but not the actual errors themselves even after drilling in. So in a way, it's over-simplified to the point of 'how many exceptions am I getting?' from each monitored system.
There is the Alert Inbox which you can launch from the Performance Overview of Events/Metrics and further drill down for alert details, but they stop short of individual alerts, only to show the number of alerts for those events and what the first/worst/last/min/max for those metric. For further analysis like when the event occurred, one would need to log into the managed system and use traditional SAP Basis transactions to analyze further, assuming those alerts/events haven't already been archived.
Figure 1: System Technical Monitoring Overview
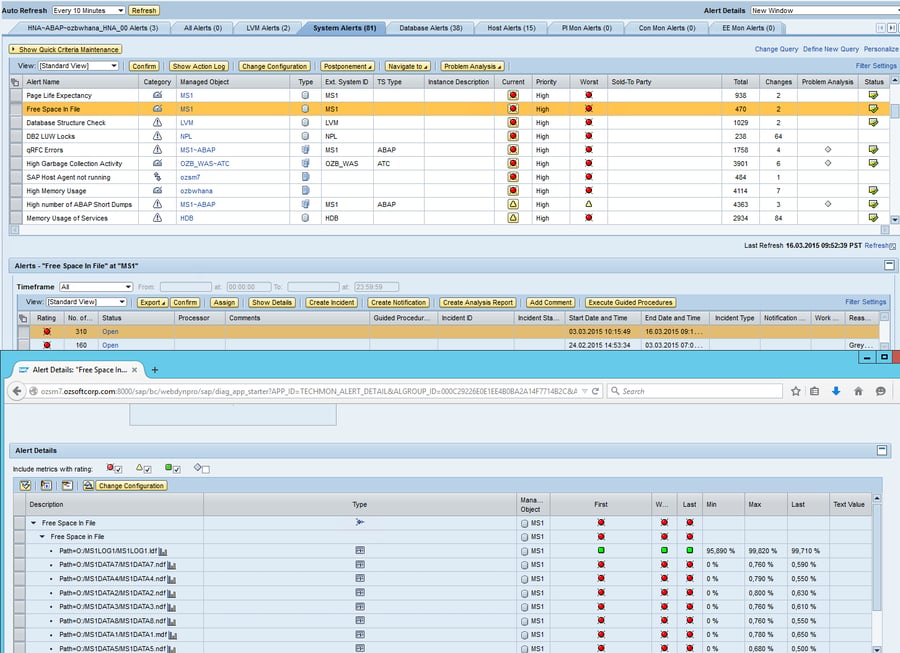
Figure 2: Solution Manager Alert Inbox & Details
There's a flaw with the above approach that it's not a single pane of glass, but rather an aggregated view that lacks troubleshooting context. I also noticed that it was quite slow in loading charts and performance information.
What's been your experience with Solman 7.1 and do you think it's useful for SAP systems technical monitoring, or is it too much work to set up and maintain for the level of usefulness it provides?

SAP Solution Manager Technical Monitoring of BOBJ BI 4.0 - Part 3 of 3 (Managed System Configuration)
The best features of SAP Monitoring and Management without Configuring SAP CCMS or Solution Manager
SAP Solution Manager Technical Monitoring of BOBJ BI 4.0 - Part 2 of 3 (Auto-Configure)