Performance monitor
A Deep Dive Into Observability
Observability is integral to better understanding your systems. Explore its importance and learn how to tackle the challenges that come with it.
Choosing the right tool is important to ensure servers are running w/o issues. Here's an overview of how you can monitor Windows systems in IT-Conductor.
Windows servers have been powering businesses for many years now. The high degree of scalability that comes with running applications on the Windows Operating System (OS) provides organizations flexibility as the business grows. This level of flexibility in an enterprise environment, however, poses some challenges when it comes to making sense of all the logs and metrics coming from various systems and applications. Especially nowadays where applications are hosted in hybrid environments, monitoring is becoming more burdensome for IT Teams.
In our previous post on Linux Systems Monitoring, we've tackled the different factors that you need to consider when choosing a monitoring tool for Linux infrastructure, the drawbacks of existing monitoring solutions, and what IT-Conductor can offer as a Cloud-based Application Performance Management and Automation Solution—all of which are also true for other OS, including Windows. In this blog post, we'll dive deep into how you can leverage IT-Conductor to monitor Windows systems.
What is Windows Server Monitoring?
Choosing a Windows Server Monitoring Tool
Monitor Your Windows Systems with IT-Conductor
Windows monitoring involves managing and monitoring the availability and performance of physical servers and virtual machines (VMs) running Windows OS. It's a key part of keeping your operations running without problems, especially if most of your applications are hosted in Windows systems. By monitoring availability and performance metrics such as CPU/Memory/Disk utilization, you can identify issues early and take appropriate actions to fix and avoid greater damage in a production environment.
Monitoring Windows servers and VMs can be accomplished using different methods such as performing system health checks, conducting performance analysis, and utilizing system management tools. By understanding which method is best suited for your needs, you can easily identify what tool or set of tools to implement in your environment. Whether you're just starting out and need a basic understanding of how to monitor your Windows servers and/or VMs, or maybe, you want to take things further and get more insights into system health, IT-Conductor may just be what you need.
Monitoring the availability of on-prem physical servers or VMs deployed in the cloud has one thing in common—they're either in the UP or DOWN state. UP state indicates that the system is available. On the other hand, DOWN state indicates that a system is unavailable. Unavailability can either be caused by polling (network access or failure to respond to a probe) or hardware issues. For physical servers, it may be caused by a total shutdown, or a server stuck in a reboot loop, perhaps after Windows patching. In some cases, the server was already decommissioned or replaced by another device but was not removed from the monitoring tool. For VMs, it may be caused by large-scale outages on the Cloud provider's end, or the VM is left as a stuck instance in need of a reboot or redeployment due to underlying physical host issues.
Regardless of what caused a Windows system to reflect a DOWN state, it is important to have a reliable monitoring tool in place to quickly detect system availability. In IT-Conductor, you can easily see the availability of a system by looking at the system grid. As you can see below, Availability is showing as GREEN which indicates that the system is available. If the availability is in a transient or unreliable state, the percentage of checks that fail to report OK would aggregate an availability percentage as less than ideal and would show as YELLOW, giving early warning while also allowing less monitoring noise if the system is able to self-recover. Otherwise, it will show as RED and the 100% availability will change to 0.00%.
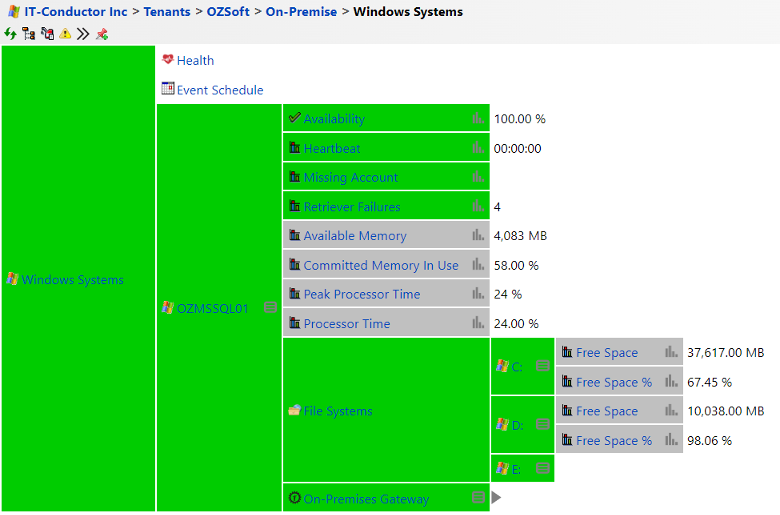 Figure 1: Windows Systems View in IT-Conductor Service Grid
You can also utilize the Availability Chart where you can see the historical availability data per system. This is helpful in scenarios where you want to investigate issues related to server availability at a certain point in time.
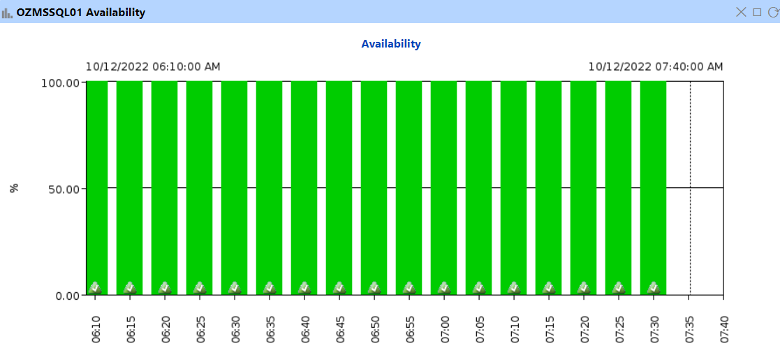 Figure 2: Availability Chart
Usually in an enterprise environment, one of the most common causes of outages is related to system performance degradation. Understanding how your system is performing will help you identify potential problems before they become major incidents.
There are a variety of performance monitoring tools available in the market. However, as pointed out in our previous post, most solutions being offered nowadays don't provide deep insights into system anomalies. This defies the purpose of monitoring systems to prevent issues early on. In IT-Conductor, you can take advantage of utilization charts, perform root cause analysis using time-synchronized troubleshooting, and leverage automated recovery actions to fix common issues.
CPU Utilization is a key metric in monitoring the performance of a Windows system. It indicates how much processing power is being utilized. The higher the CPU utilization, the more work is being done by the system and the greater the potential for system instability which is why it's important to track CPU usage, particularly in the context of system workloads. In the Processor Time Chart below, you can see the variations in utilization over a certain period of time.
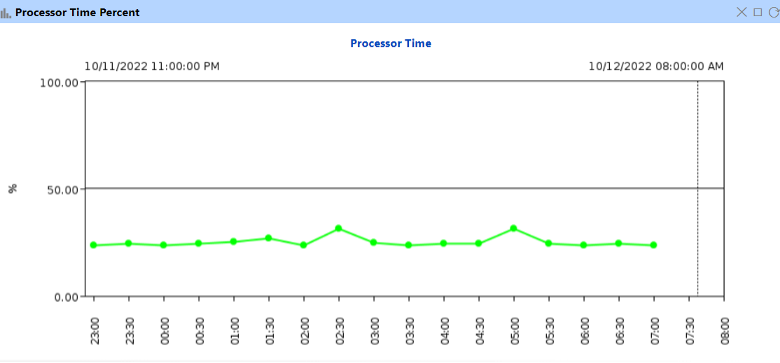 Figure 3: Processor Time Chart
In the Peak Processor Time Chart below, you can see the highest utilization recorded at a specific point in time. This chart is useful in situations where you want to investigate why applications are slowing down. If you happen to notice that the data points are constantly above the thresholds you initially set, it’s about time to plan and upgrade the processor.
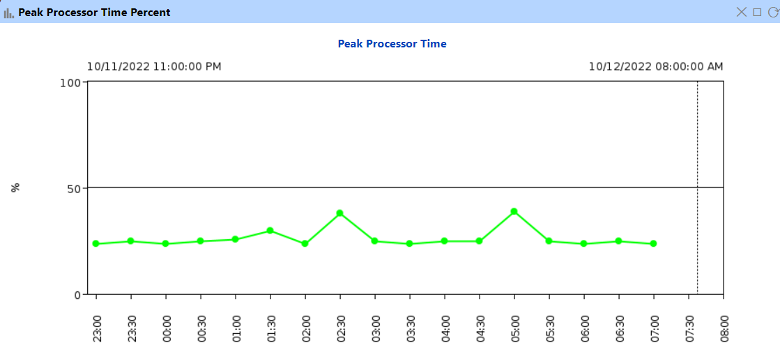 Figure 4: Peak Processor Time Chart
Memory utilization is a metric that indicates how much memory is being utilized by all the running services and applications in a server. Like the CPU, memory is also designed to run at full capacity. However, maximizing its power also causes a degradation in system performance which is why monitoring memory utilization is also important in making sure your systems are healthy.
In IT-Conductor, the available memory and committed memory in use are also seen from the service grid (See Figure 1). If you want to dig deeper and investigate, you can utilize the Available Memory and Committed Memory In-Use Charts as seen below.
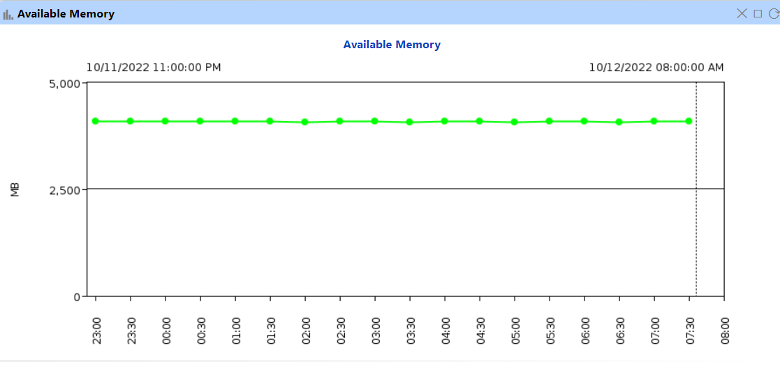 Figure 5: Available Memory Chart
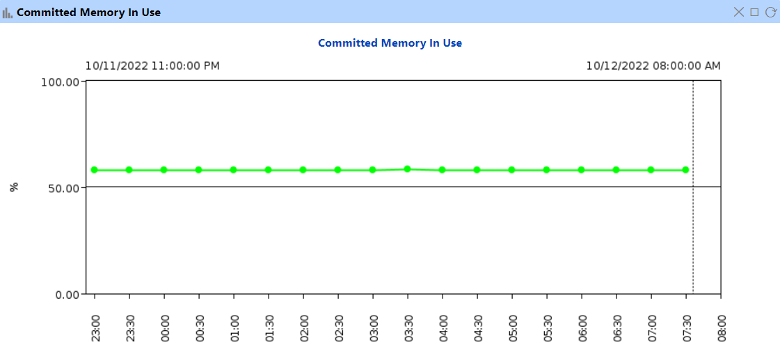
Figure 6: Committed Memory In Use Chart
Disk utilization is simply the amount of disk space that is currently being used. It is also often represented as a percentage. In some cases, the amount of free space is indicated instead. Disks are designed to store a specific amount of data. However, utilizing the capacity of disks at 100% can also cause a degradation in system performance.
In IT-Conductor, disk utilization of Windows Servers is represented as the amount of free space in percentage (%) and in megabytes (MB) or gigabytes (GB).
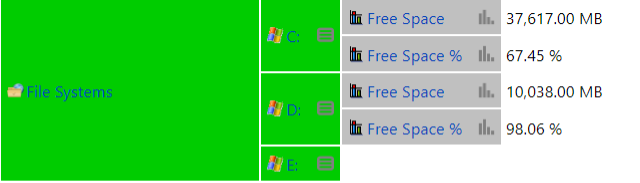 Figure 7: Free Space in IT-Conductor Service Grid
Availability and resource utilizations provide a critical set of Key Performance Indicators (KPIs), but to get better analysis into the observability of Windows systems, other dimensions such as Workload (e.g. most commonly Microsoft SQL*Server Database Monitoring), processes, network interfaces, Windows events, are all possible with IT-Conductor's flexible Windows monitoring adapter which integrates with Windows Remote Management (WinRM) and Windows Remote Shell (WinRS) framework.
Choosing the right Windows Server monitoring tool is important for ensuring that servers are running without issues. There are several options available in the market and it can be difficult to decide which one is best for your needs. So here are a few things that you should keep in mind:
Robust Engine - Monitoring servers is not the only monitoring needed to keep your business operational. You should also be able to monitor the applications that reside in it. Ideally, choose a solution that is capable of monitoring anything and is highly configurable. This way, you don’t have to monitor different systems from different tools. Find a solution with Unified Monitoring capability and start from there.
Easy Implementation - Before you settle on a particular monitoring tool, you should determine whether it requires installation on every system or through a centralized server that will serve as your gateway. This will determine the scope and complexity of your deployment. If your environment is small, either of the two will work. For enterprise environments, it is highly advisable to go for the latter.
Easy to Use - While we suggested looking for a tool that has a wide range of features, there’s still value in satisfying user experience (UX). UX is more than the aesthetic requirement that’s pleasing to the eyes. When choosing a tool, the way data is organized and presented should be easy enough to navigate. You might not want to settle on a tool that often ends up confusing end-users.
IT-Conductor is a Cloud-based Application Performance Management and Automation Solution that allows you to monitor, manage, and orchestrate enterprise IT through Intelligent Automation. Built with a massively parallel processing engine, IT-Conductor lets you manage distributed systems more efficiently and make it simpler for you to perform your tasks.

Observability is integral to better understanding your systems. Explore its importance and learn how to tackle the challenges that come with it.
Observability goes beyond gathering data and making sense of it. Here are some ways you can do to build observable systems.
End-user experience is changing how organizations define success. Knowing how to monitor and make sense of it will help you make better business...