Application Performance Management (APM) tools have evolved with the modernization of applications and IT infrastructures. From simply monitoring the availability and performance of legacy applications to having the ability to discover and analyze distributed systems, we found ourselves in dire need of understanding systems and applications on a much deeper level.
If your job requires you to manage applications and oversee the health of all the components in your monitored systems, you may already have heard of the term observability. It's a buzzword that is often used interchangeably with monitoring. But is it just a synonym for monitoring, or is there more to it that you should know? Let's cut to the chase and give you some answers.
What is Observability?
Observability is the ability to observe and understand the internal state of a system based on the data it generates. The concept of observability has its roots in control theory. It was first introduced by Rudolf Kálmán, a Hungarian-American engineer, as a method to determine the behavior of an entire system using only the information from its outputs.
There's no telling when it was first used in the context of IT systems, but in 2013, engineers at Twitter published a blog post about Observability at Twitter. As a prominent platform for online engagement, word spreads fast. Through numerous discussions, the three pillars of observability—metrics, logs, and traces—were introduced.
Three Pillars of Observability
Working with metrics, logs, and traces allows you to debug systems and even detect issues you can remediate to prevent causing more significant problems. Understanding these three will guide you in building observable systems.
Metrics
Metrics are measures of how your systems are performing over time. They can be fed into visualization tools to create dashboards from which you can derive information about service-level objectives (SLOs), service-level agreements (SLAs), and service-level indicators (SLIs). Examples include uptime, response time, CPU and memory utilization, etc.
Logs
Logs are system-generated events that generally contain information about what's happening in a system. They often include a timestamp and a brief description of the event. When troubleshooting issues, engineers look at logs to determine when the issue occurred and what resources were affected.
Traces
Traces represent how requests traverse the different nodes in a distributed system. It allows you to examine the end-to-end transactions between systems, helps you identify bottlenecks, and provides you with more information about the overall health of your systems.
Monitoring vs. Observability
Observing an application's state is vital to understanding the behavior of an entire system landscape. While monitoring informs you when something goes wrong and where it occurred, observability tells you why something failed. This level of visibility into systems helps organizations resolve issues faster and lower operational risks that may disrupt business operations.

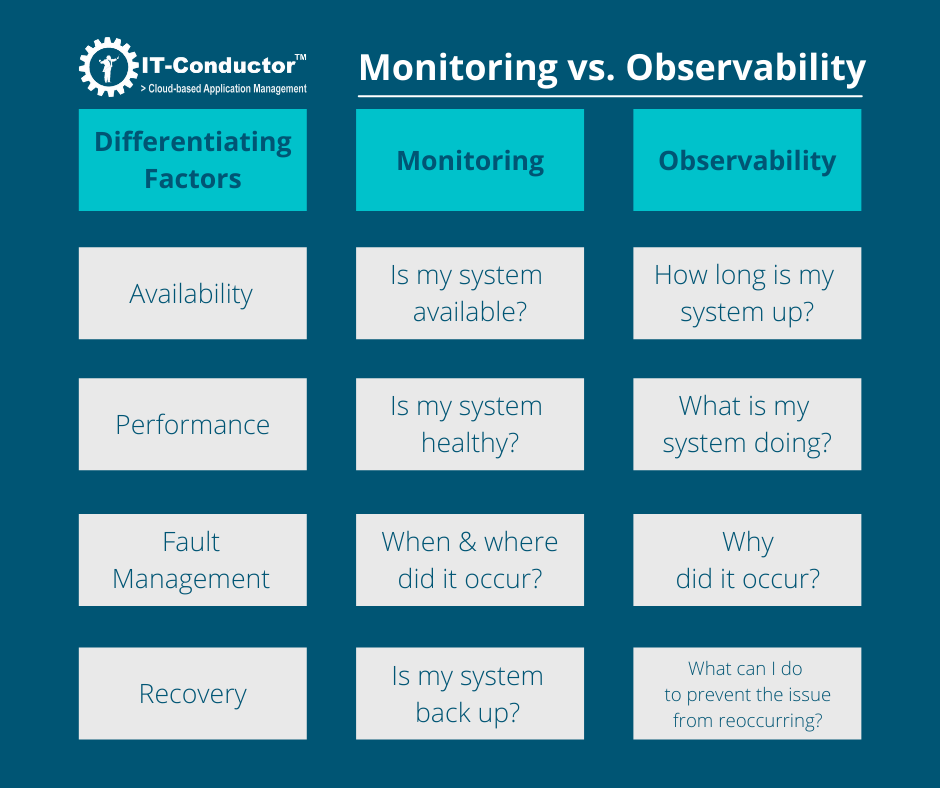
Figure 1: Monitoring vs. Observability
The questions above illustrate the difference between monitoring and observability. Monitoring allows you to gather data about the state of your systems, while observability lets you interpret that data to help you understand the state of your systems. For example, asking, "Is my system available?" only tells you whether your system is available (UP) or not (DOWN). In contrast, asking, "How long is my system up and running?" provides insights into uptime or downtime based on the data collected over a certain period.
The question "Is my system healthy?" can be confusing because it provides more nuanced information than a simple availability check. Performance metrics often define system health based on predefined thresholds. For example, a system might be deemed unhealthy if its memory utilization exceeds n% and CPU utilization surpasses n% over the past n days. With observability, you can go beyond detecting that thresholds have been exceeded. It allows you to investigate the root causes behind the issue. For example, the system might require data cleanup due to excessive usage, or resources must be reallocated to balance workloads. In the worst-case scenario, observability might reveal that the system is signaling the need for a hardware refresh.
The same applies to the third and fourth questions. Monitoring simply identifies when and where an issue occurred, but observability goes a step further by helping you pinpoint why it happened and whether your system has fully recovered. Moreover, observability provides insights into proactive measures you can take to prevent the issue from recurring in the future.
Addressing Observability Challenges
The progressive delivery of applications nowadays has led to the transition of legacy applications to a microservices architecture where applications are distributed into different containers as a set of services, each running on its own. With this modular approach to application deployment, there will be multiple runtime environments and possibly overlapping functions. As a result, organizations face more complex scenarios, and traditional APM tools may be deemed insufficient. This is where cloud-native APM tools are changing the game for monitoring modern applications by taking advantage of cloud computing to support their sophisticated nature.
Given the complexities of monitoring a constantly changing environment, achieving observability at scale can still be challenging, even with cloud-native APM tools. A comprehensive monitoring solution can help avoid getting lost, especially when monitoring hybrid cloud environments.
So, what comprehensive monitoring solution should you be looking at?
Data Observability
We have repeatedly mentioned how data plays an important role in making your systems observable. The whole purpose of observability relies significantly on the data gathered from monitoring systems and applications. Having the ability to manage the health of your data is crucial for achieving observability. However, monitoring modern applications involves managing several components and subsystems, each producing a gigantic amount of data.
A comprehensive APM solution should give you a holistic view of your entire data stack. By that, we mean having the ability to see the health of your data services in one dashboard, view traces and error logs for failed dataflow, monitor the status for both real-time RFC connections and RFC servers, identify why remote connections might be broken, monitor if the job server and repositories are enabled or disabled, and finally get notifications about failed jobs. Specifically for monitoring SAP Data Services, you need a comprehensive solution that can also monitor all the dependencies (i.e., applications, DB, and OS) for end-to-end systems such as S/4HANA, SAP SLT, and cloud endpoints.
End-to-End Orchestration
Speaking of end-to-end systems, a comprehensive solution must automatically discover the relationships between the different components in your entire system landscape. This advanced discovery feature is essential in monitoring not just legacy applications but also microservices in production. Manually managing workloads of this scale is simply out of the question.
Take advantage of platforms that allow legacy and modern applications to discover each other in the network. These platforms orchestrate complex IT operations while increasing your systems' observability. The more components your system has, the harder it will be to manage, monitor, and keep everything in check. That's why it's beneficial to implement a comprehensive monitoring solution that can help you understand what's happening across the board.
End-User Experience Monitoring
End-user experience monitoring is one of the key metrics organizations often neglect when dealing with service-level agreements. When a customer complains about slowness, application support teams usually blame the network in an instant. This becomes an obstacle to achieving observability because you’re kept in a blind spot when knowing what transcends the application layer.
Specifically for SAP customers, end-user experience monitoring allows you to see how end users interact with the application. This, in turn, allows support teams to investigate the possible cause of the application performance issue instead of immediately blaming the network team. A comprehensive solution should, therefore, be able to monitor end-user experience.
Key Takeaway
Observability is integral to better understanding your systems. It is more than gathering data about availability and performance metrics, as traditional monitoring or APM tools would. It allows you to build a more comprehensive picture of each component you want to measure.
In the context of monitoring systems in hybrid cloud environments, implementing a cloud-native APM solution allows organizations to use cloud computing to discover and analyze distributed systems, particularly microservices in production. However, achieving observability at scale can still be challenging. A comprehensive APM solution designed to give you a holistic view of your entire data stack, discover and manage workloads, orchestrate complex IT operations, and monitor end-user experience would help you get started with making your systems observable.
Frequently Asked Questions