SAP has been widely regarded for its software solutions having complex user interfaces. In May 2013, when SAP announced the launch of SAP Fiori as “a collection of apps that are simple, easy-to-use, and provide an intuitive user experience for broadly and frequently used SAP software functions, across a variety of devices — desktop, tablet, smartphone — to help easily get the job done”, the way users access backend data started changing gradually from using transaction codes, or tcodes, to simply navigating around a user interface easily accessible from web browsers.
Intuitive user experience involves more than just having a functional design. As a comprehensive design system built to simplify the experience for SAP customers, SAP Fiori must maintain a high level of availability. Like any other system landscape, you also need to proactively monitor its components to prevent issues that may have a huge impact on the business.
Table of contents
What is SAP Gateway?
Why Monitor SAP Gateway?
Scenario 1: Slow Response Time
Scenario 2: System Capacity Overload
System Monitoring vs End-User Monitoring
SAP Gateway System Monitoring
SAP Gateway End-User Monitoring
What Now?
Monitoring SAP Gateway Simplified
End-to-End Monitoring of SAP Gateway
Integrated Dashboards & Reporting
Drill-down Feature
Manual, Triggered, or Scheduled Execution
What is SAP Gateway?
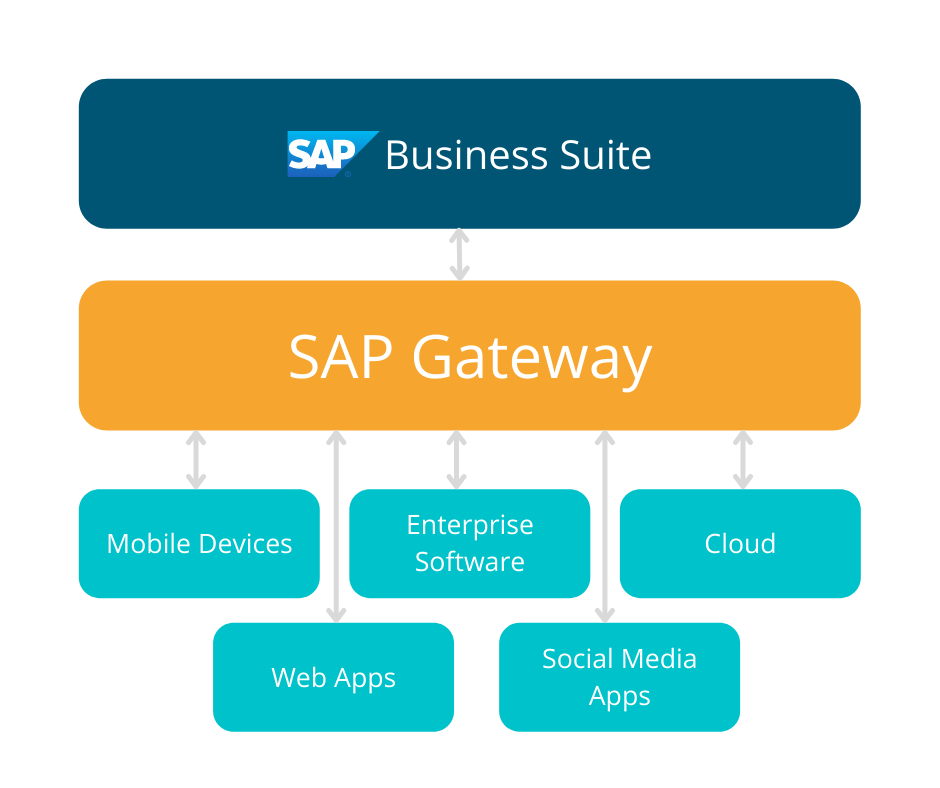
SAP Gateway plays a key role in the SAP Fiori system landscape. It is an open-standard-based framework that enables connection between SAP systems and all types of devices, environments, and platforms. Its capability to integrate SAP into non-SAP applications allows the development of solutions based on REST and OData protocols, further improving mobility and user experience.
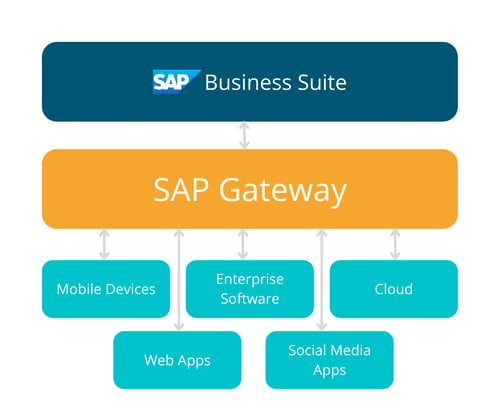
Figure 1: SAP Gateway
SAP Gateway consists of several add-ons of which are required, and others are only optional. It is commonly deployed either via central hub deployment, embedded deployment, or using SAP Cloud Platform OData Provisioning. Regardless of how the gateway is deployed, you will most likely find it difficult to make sense of everything without a comprehensive monitoring solution that allows you to monitor your systems in a way that you can easily distinguish the different components that make up your entire system landscape.
Why Monitor SAP Gateway?
Monitoring the components of an SAP Fiori system landscape, especially the SAP Gateway, is vital in ensuring that SAP Fiori applications are running without issues as it is the underlying technology that makes it possible for users to easily retrieve data from the backend.
Scenario 1: Slow Response Time
In a scenario where there is a slow response time, the issue may not necessarily exist in the backend system. It may be because of a bottleneck in the gateway. For SAP Basis administrators, it would be a challenge to tell that outright without a comprehensive monitoring solution. Having to figure out the cause of the slowness would require diligent investigation and may even involve several infrastructure teams. In this situation, IT-Conductor can give a clear insight into the cause of the problem. With the aid of its drill-down features, you can quickly detect where the bottleneck lies.
Gateway monitoring allows SAP Basis administrators to figure out how much traffic is passing through the gateway and how much of that traffic is transactional.
Scenario 2: System Capacity Overload
In another scenario, a bottleneck in the gateway may cause an overload in system capacity. Let’s say, for example, you are expecting to process 100,000 orders during the holiday season. Since a single order only takes a split second to process, you are 100% confident to meet your goal. After the holiday season is over, you notice that you were only able to process 50,000 orders, leaving half the volume in the queue, or worse, left unprocessed because the transaction got stuck somewhere. As the SAP Basis administrator, you were asked to investigate what may have happened.
Without a monitoring system capable of logging historical transactions with defined metrics that can drill down up to the user level, it would be a challenge to check what transactions failed to run successfully, how much time was spent for failed transactions to execute, and how big do those failed transactions consumed in terms of utilization. All of these factors may indicate that your systems experienced system capacity overload.
Gateway monitoring allows SAP Basis administrators to identify if your systems, indeed, experienced system capacity overload by looking at the various metrics relevant to the service(s) or application(s) in your system landscape.
System Monitoring vs End-User Monitoring
To further appreciate the importance of monitoring SAP Gateway, let’s consider the idea of managing system landscapes from two different points of view—system monitoring and end-user monitoring.
SAP Gateway System Monitoring
As its name suggests, SAP gateway system monitoring involves monitoring the system status of your SAP gateway including availability, utilization, and other performance metrics defining your KPIs as an organization. It is in system monitoring that you stay alert for errors and perform necessary measures to prevent system failures.
SAP Gateway End-User Monitoring
End-user monitoring, on the other hand, puts focus on monitoring the user experience as seen from a specific service or application. In essence, SAP gateway end-user monitoring involves monitoring the connection between the end-user device and the SAP gateway. This may refer to monitoring the time it takes to process and load data from the backend to the SAP Fiori user interface. Or perhaps, the responsiveness of the Fiori applications when accessed from client machines.
What Now?
System monitoring, in itself, is already challenging. Considering that an organization has several users accessing big chunks of data from various applications, it would be a challenge to make sense of all the performance metrics involving user experience.
Monitoring SAP Gateway Simplified
IT-Conductor delivers summarized gateway performance statistics on specific services at intervals based on user-requested attributes. The aggregates are available as interactive charts and reports for IT-Conductor users. With this functionality, you can view the historical trend and monitor a particular service or application in real time.
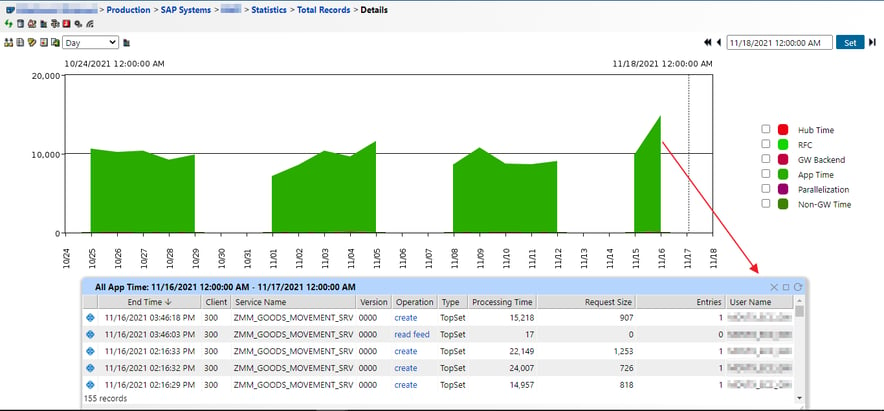
Figure 2: SAP Gateway Monitoring with IT-Conductor
You can also configure alerts to be sent directly to the e-mails of respective recipients responsible for addressing performance issues if thresholds are exceeded. Reports can also be customized and scheduled to be sent regularly, allowing you to see performance metrics (i.e., the number of entries processed, request size, response size, etc.) depending on how you want to process information.

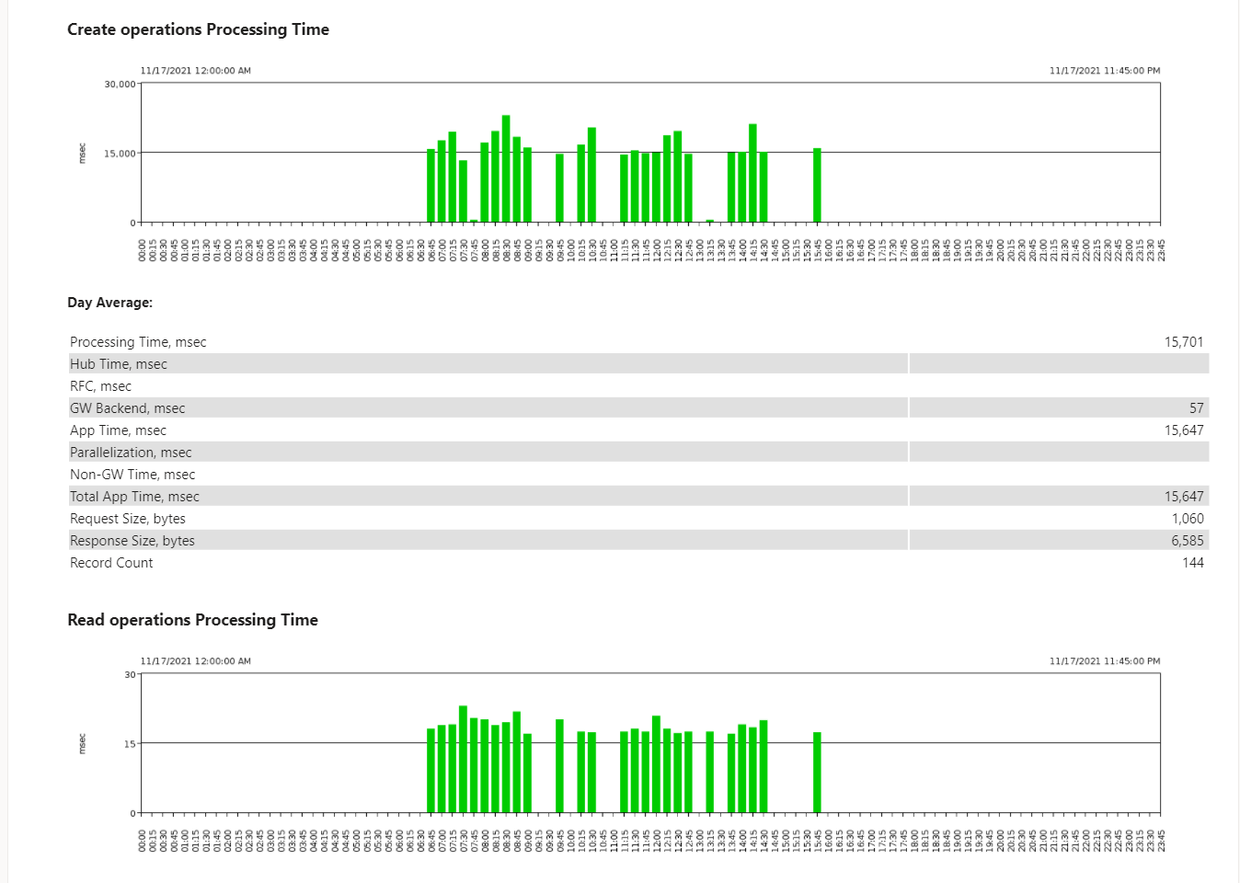
Figure 3: Sample SAP Gateway Monitoring Report
Other reporting scenarios can include a daily report of gateway application-specific information such as the total count of records for the earlier day, average response time per day for each operation type, etc.
End-to-End Monitoring of SAP Gateway
One of the key benefits offered by IT-Conductor is the End-to-End monitoring scope for the SAP Gateway and your entire SAP system landscape. Irrespective of the complexity of your SAP environment, IT-Conductor gives you the capability to monitor x number of SAP gateways and the backend systems from a single centralized platform. This reduces administrative overhead and supports your capacity to scale.
With IT-Conductor, you gain a better understanding of the workload statistics of your SAP Gateway and benefit from the end-to-end web-based transaction monitoring provided by the platform.
Integrated Dashboards & Reporting
Using IT-Conductor for SAP Gateway monitoring also allows you to carry out top-down analysis, view the relationship among its various components, and determine how they impact each other.
You also have the option to customize dashboards that show the relationship between the SAP Gateway and your backend systems.
Drill-down Feature
The drill-down feature of IT-Conductor and the breadth of components it monitors distinguishes it from the rest of the tools in the market today.
Manual, Triggered, or Scheduled Execution
Aside from monitoring your SAP Gateway, IT-Conductor also enables you to perform other operational tasks like the restart of stopped services, etc.
Our approach towards SAP Fiori application monitoring enables the operation team to minimize downtime, improve productivity, and ensure optimal performance.