Are you hopeful or worried that SAP patches may fix or break your system's performance? Let's face it, if we have a specific problem, we hope a patch will fix it. However, given patches are now mostly delivered in packages or bundles (particularly support packs), we're worried at the same time it may break something else. Even if all functionality remains intact, there is always a chance performance may be impacted, for better or worse.
That's why we recommend including SAP Performance Best Practices for Implementation, Upgrade & Migration. Case in point, while monitoring Solution Manager with IT-Conductor (yes that will be another topic in itself that we'll cover in another post), we were pleasantly surprised, unlike most cases, that a set of patches actually improved the system performance. Without the proper SAP monitoring tools and context, it would be pretty hard to pinpoint the cause and effect of such action.
Let's see how we became aware of problems and then related the cause and effect.
Identifying Issues
Service level alerts and notifications indicated that the system was under stress with automated Health checks.

Figure 1: Service Level Health Chart
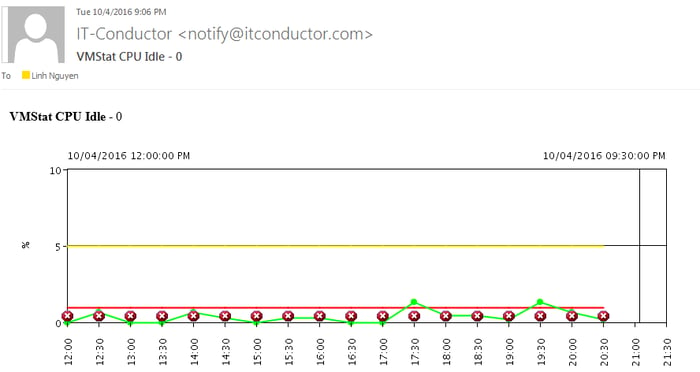
We also received an e-mail notification via subscription that one of the app servers had prolonged periods of "CPU Idle 0%".

Figure 2: CPU Idle E-mail Notification
Finding the Root Cause
In Figure 1, we can click on a single button to determine the cause from all underlying components monitored for the system (or what we better refer to as a Service).
Expanding the service tree where there are warning indicators, we find both background utilization and CPU Idle on the same page with a high degree of negative correlation (i.e., Batch processes maxing out while CPU Idle hugs the zero line.)

Figure 3: Background Utilization Chart

Figure 4: CPU Idle Chart
What workload was running that took all the batch work processes? Well, this is pretty hard to find in hindsight, but we've got a secret weapon! Click on the app server icon having the issues and a menu pops up with a choice to look at the SAP Work Processes Snapshot.
Looks like we had a combination of Solman batch and ChaRM running for a long time, and no free batch processes.

Figure 5: SAP Work Process Snapshot
Resolving the Problem
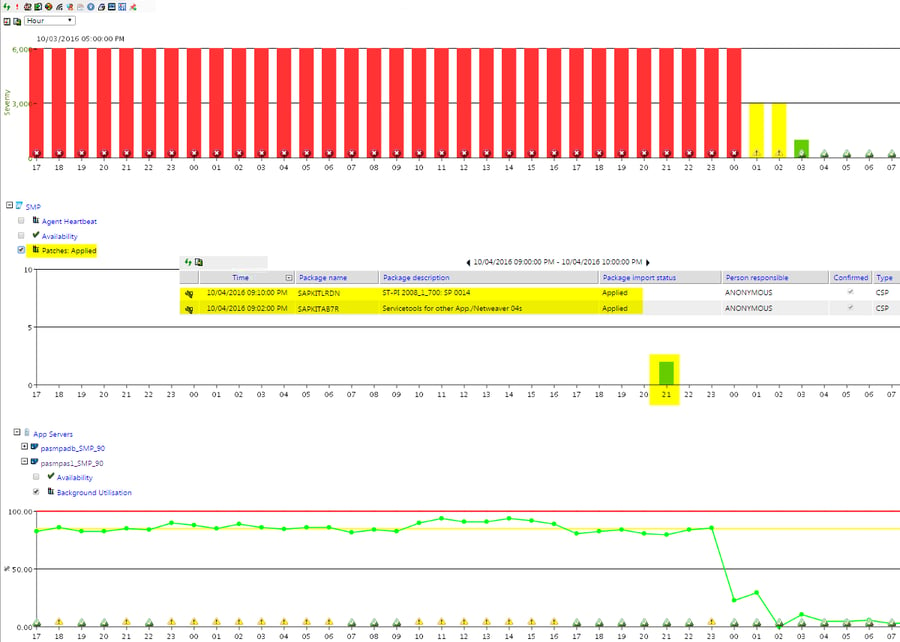
The Basis team applied some Solman add-on support packages, and guess what happened? In Figure 6, the middle chart shows when patches were applied, things began to improve around midnight. Was it a coincidence? Maybe, but what's probable, look at the correlation when charts of metrics and events are synchronized with each other, all on a single pane.

Figure 6: Time Synchronized Troubleshooting in IT-Conductor
The Verdict
While patches can be fixed, they can also break, so the wise should have tools to measure before and after and be able to show root-cause correlation, all part of the service level management plan.
Looking for an integrated solution to help with many of the SAP Performance management needs?
Try IT-Conductor, engineered as a cloud-based SAP Performance management and monitoring platform. We also offer SAP Performance management as a Service!
