Performance monitor
A Deep Dive Into Observability
Observability is integral to better understanding your systems. Explore its importance and learn how to tackle the challenges that come with it.
Observability goes beyond gathering data and making sense of it. Here are some ways you can do to build observable systems.
Building observable systems requires understanding the concept of observability and its three pillars—metrics, logs, and traces. However, implementing a solution based solely on the three pillars is not enough. There is more to observability that goes beyond gathering data and making sense of it.
In the context of managing distributed systems, observability should tap into the entirety of your system landscape instead of its individual components.
After all, the goal of observability is to make your systems easier to understand. Managing individual components contradicts the essence of building observable systems. Taking a unified approach to managing your entire system landscape is key to building observable systems the right way.
How we understand the availability of data lays the groundwork for building observable systems:
Data that we are aware of and understand (known knowns)
Data that we are aware of but don't understand (known unknowns)
Data that we understand but are not aware of (unknown knowns)
Data that we are neither aware of nor understand (unknown unknowns)
While all of these are important in understanding your systems, observability takes part in understanding the unknown unknowns.
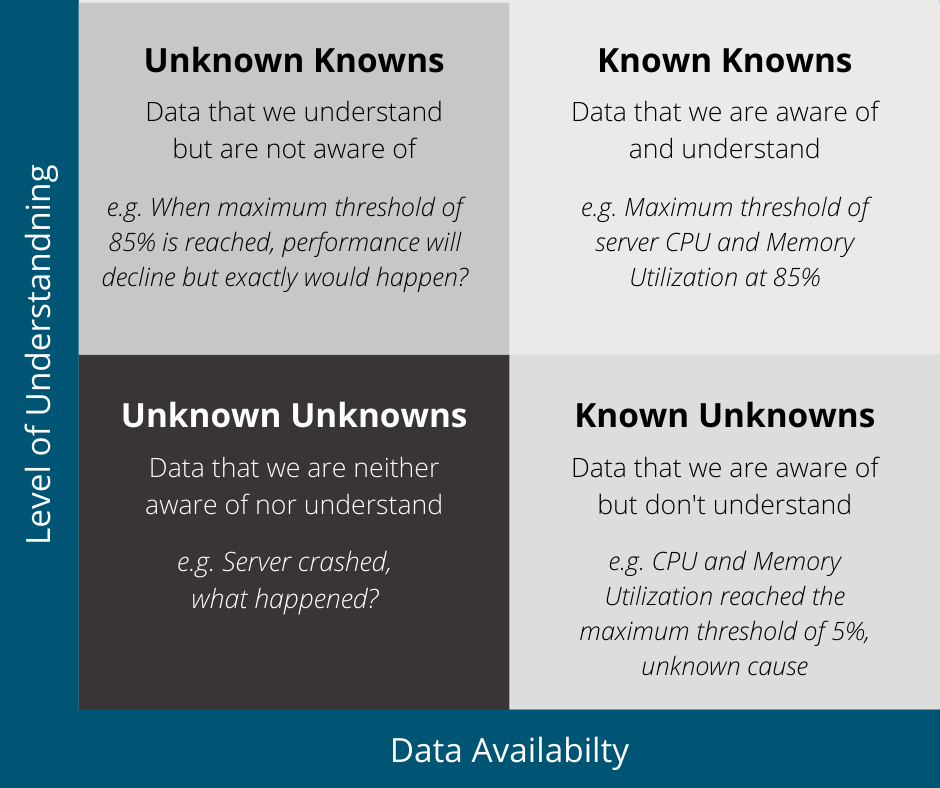
Figure 1: Known Unknown Matrix
For instance, you have predefined the maximum threshold of a server to be at 85% for both CPU and memory utilization (known knowns). When the maximum threshold is exceeded, you will receive an alert, but you wouldn't know what caused the spike (known unknowns). You understand that when the maximum thresholds are exceeded, the performance of the server will decline but you're not capable of determining what exactly would happen (unknown knowns). So, you implemented an automated action to throttle the workload and perform application housekeeping, such as garbage cleanup to free up some memory whenever the maximum thresholds are exceeded to keep the server in good health. But then the server crashed, and you never found out what caused the breakdown (unknown unknowns).
Traditional monitoring tools cater to managing the known knowns, known unknowns, and sometimes even the unknown knowns. However, it would be least likely that unknown unknowns would be captured. This is where observability tools come in handy. Depending on your requirements, you can develop a mechanism to capture and understand the unknown unknowns to prevent system failures from happening—say, implementing a catch-all exception handling and executing a recovery action every time a system fails, or perhaps, when a transaction does not complete its lifecycle.
Observability also addresses the challenge in capturing data with high cardinality. Metrics with high cardinality refer to data that have several values and are often unique such as user IDs, system IDs, etc. Traditional monitoring tools are only capable of capturing metrics with low cardinality. Therefore, they would no longer be sufficient when building an observable system. The use of modern tools to capture data with high cardinality provides the flexibility to group metrics by categories or tags, design a workflow to filter out unknown unknowns, and help yield better outcomes.
The advantage of using metrics makes troubleshooting simpler by configuring alerts and notifications. You may be tempted to capture everything for alerting but in building observable systems, it's best to limit alerting to metrics that satisfy service level agreements and conditions impacting end-user experience. This approach avoids data overload and increases information quality leading to better performance intelligence.
Using metrics alone would hamper the diagnosis of anomalous behavior in a system. So, the use of the metrics, logs, and traces altogether is still the very foundation in achieving observability. However, there comes a challenge in using logs to account for individual transactions. The cost of logging becomes too expensive as it is directly proportional to the application transaction rate per service, the cost of network and storage resources, and the data retention period.
As the organization grows and adopts more services from various vendors, the logging system would, at a certain point, reach its maximum capacity and could no longer afford to store data about every transaction. But for developers, logs are valuable assets. When something goes wrong, developers would most likely look for logs so we cannot really remove logging entirely. Just like metrics, not all logs need to be captured. Since observability is based upon events, you should focus on collecting logs from the perspective of the request and how it traverses the distributed system.
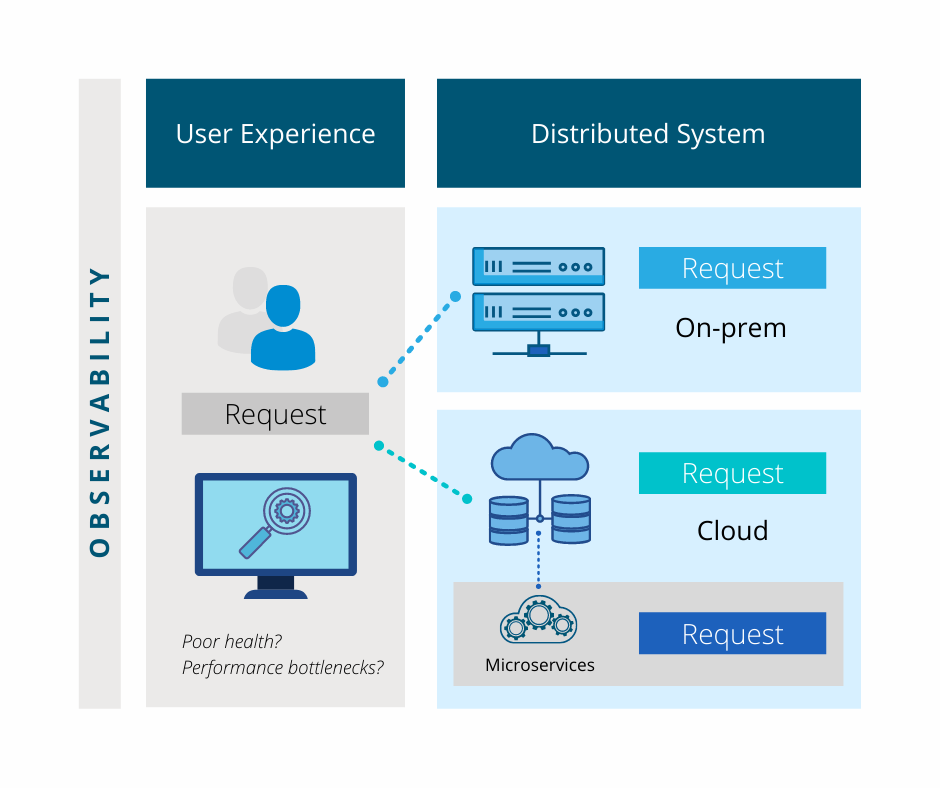
Figure 2: Observability in a Nutshell
For instance, when a service request is initiated, you need the ability to tell how the request executes end-to-end which now brings us to distributed tracing. While logging provides context to understanding how an event occurs, observing requests as they propagate different environments allows the early detection of components with poor health, locating performance bottlenecks, and even gathering data about transactions that take place between services.
Data aggregation and correlation aid in the formulation of inferences about systems. You should be able to trace the path of a request and determine what has happened. Correlating metrics, logs, and traces from different sources enable you to quickly figure out what's happening and what could possibly cause it.
With the adoption of microservices, systems tend to change more often and become more complex. Predicting how an application will behave in production after release is becoming more difficult. To achieve observability in an environment that is constantly changing, you need to adopt Agile and DevOps practices.
The adoption of DevOps is rooted in the need to support applications even after being released in production. As system failures cannot be avoided, there must be a way for development teams to quickly debug systems when an unforeseen event occurs. The challenge now comes from the old mindset that production is the end of the road for development teams and the accountability of supporting application failures in production is given to operations teams.
With DevOps, the gap between the development and operations teams is brought to a close. In fact, DevOps teams are now considered to be largely responsible for ensuring the reliability of systems through observability. So, it is imperative that you adopt DevOps practices in building an observable system.
Agility comes hand-in-hand with DevOps. One cannot stand on its own without the other. To achieve observability, systems must be fast to adapt to the changing nature of their environment and be able to quickly revert back to their previous state should the system experience an error or a failure.
Another goal of observability is maximizing the availability of data to visualize your entire system landscape with minimal effort. Given the scenario that your environment is hybrid, with both legacy applications and microservices, it would be nearly impossible to achieve observability without automating the discovery and mapping of IT components.
Traditional monitoring tools are often faceted with features to collect metrics and configure alerts, but almost always nothing about the auto-discovery and mapping interdependencies. The development of modern APM tools paved the way to bringing the auto-discovery of IT components at the core of monitoring.
The aggregation and correlation of telemetry are only possible if the observability platform in use can handle data coming in from different sources and knows how to map their interdependencies. But remember, tools are only half of the equation. Users should also be able to easily conceptualize applications and their underlying infrastructure in an observability platform to fully achieve observability.
A unified approach to building observable systems means having the ability to observe systems in such a way that all of their components are seen more as a whole than as an individual. Understanding the three pillars (metrics, logs, and traces) is required but it's not enough without fully knowing how they are all interdependent with each other. The aggregation and correlation of telemetry address this need and with the use of a platform capable of handling data from different sources and relating them, inferences about the system's health and performance can be established.
No system is immune to failure. This is the very reason why the concept of observability was applied in IT systems. Investing in an observability platform is just the first step in achieving observability. Understanding the unknown unknowns come next, capturing metrics with high cardinality comes second, and so on. But before you think about what platform(s) to use, consider building a blueprint of your distributed systems in production first. You have to understand that as you scale, the more difficult it would be to achieve observability. Taking this into consideration, you should be able to successfully build observable systems.
The next time a system fails, and you're asked what caused it, you should already be able to answer in a flash what may have caused it and how it can be solved.

Observability is integral to better understanding your systems. Explore its importance and learn how to tackle the challenges that come with it.
Observability alone isn’t enough. Orchestration defines what happens next.
AI is reshaping SAP operations on AWS. Learn how new AWS capabilities combine with IT-Conductor for automation and unified observability.