Ever want to collectively view many KPIs across multiple SAP systems and infrastructure components, even across many sites or locations? It's always been a challenge to do so, especially to monitor SAP, analyze or trend performance end-to-end, and see the big picture at the same time. It's a best practice to use such capability in an application performance management (APM) tool as we discussed in our 10 Ways to Better Application-Centric Service Management Best Practices. Recently in our first IT-Conductor Newsletter February 23, 2017 edition, we announced the availability of a feature to Save Custom Service Charts (KPIs). The ability to see KPIs across multiple monitored services had been there for years, but recently we allowed users to save and view them, and even schedule reports for them as a Saved Service Health Chart.
Use Cases for Custom Service Charts
We have found the application of such Saved Custom Service Charts to be very useful for the scenarios below:
- Performance Test Monitoring
- Performance Test Reports
- Adhoc Report of Overall Service Health
- Scheduled Report of Overall Service Health
- Performance Analysis
- Root-cause Analysis
Chart Examples
Single System with Multiple Application and Infrastructure Components
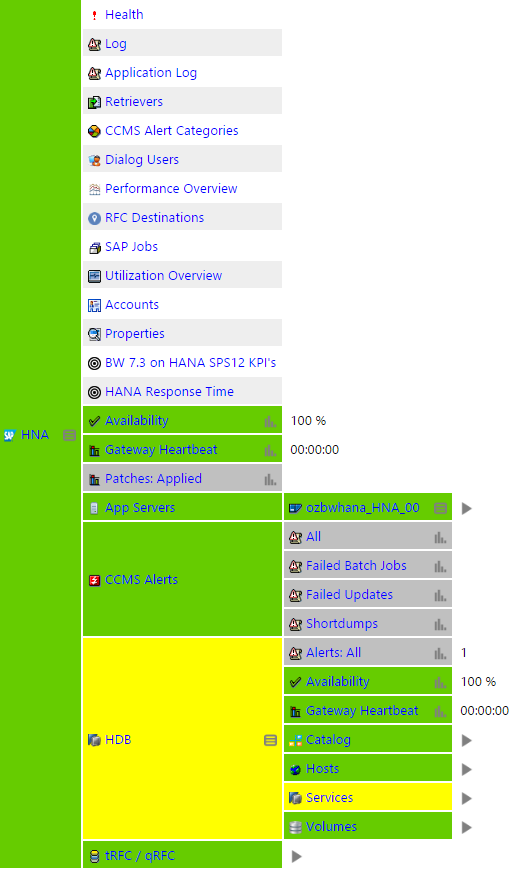
For instance, BW on HANA display monitors across:
- Availability of BW service
- Application server Dialog DB Request Time
- Application server Dialog Users Logged In
- Application server Dialog Response Time
- CCMS Alerts in Time Intervals
- HANA Alerts in Time Intervals
- Availability of HANA SID service
- HANA Service Utilization CPU, Memory
- HANA Service Response Time
- HANA Service Running Threads
- HANA Data Volume Space Utilization
- Linux CPU Utilization
- Linux Free Memory
 Figure 1: Single System with Multiple Application and Infrastructure Components
A sample report, either ad hoc or scheduled, can be generated and delivered in HTML or PDF.
Multiple Systems
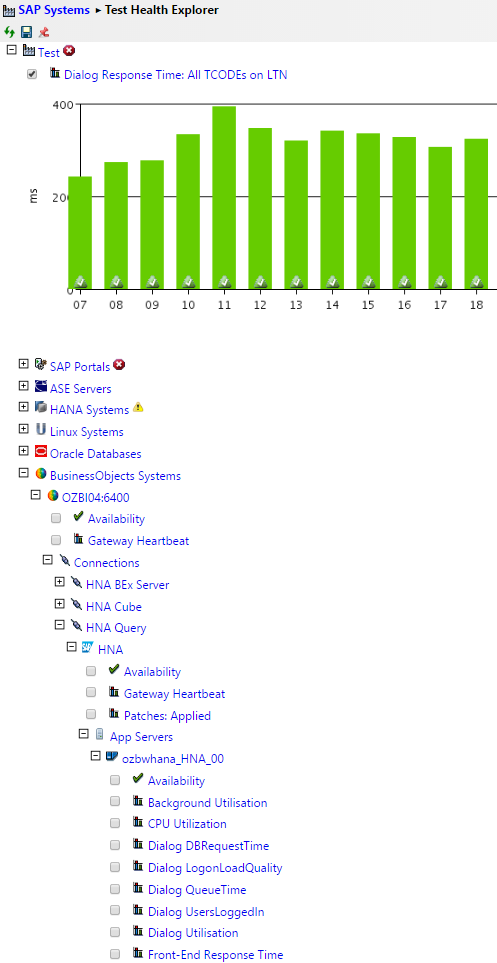
For instance, BOBJ reporting performance connected to BW on the HANA data source and ECC transaction backend:
- BOBJ Availability
- BOBJ Alerts in Time Intervals
- BOBJ Probe Performance
- BOBJ Enterprise Nodes Performance
- BW on HANA KPIs (see above example for Single System)
- ECC Transactional Response Times for specific TCODEs

Figure 2: IT-Conductor SAP Monitoring Health Explorer for KPIs across Multiple Systems
Multiple Sites
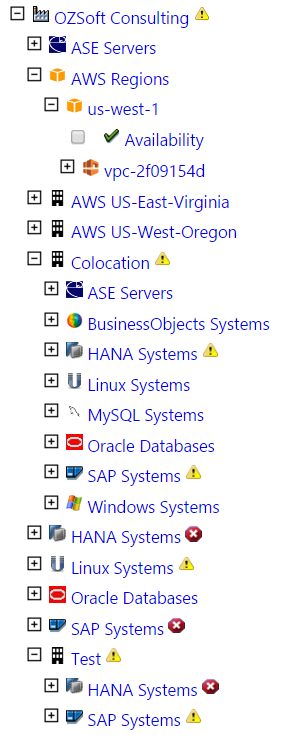
For instance, on-premise systems connected to cloud applications. The example below indicates a high-level company-wide IT health services which include cloud, on-premise, and cross-applications hierarchy that could have a composite set of KPIs to view availability and performance across any monitor of interest.

Figure 3: Service Hierarchy Available for KPI creation across Boundaries
SAP Performance Redefined with IT-Conductor
Innovation of APM intelligence has brought IT-Conductor to continually create and provide agile cloud services. The solution helps organizations manage complex enterprise application environments across boundaries of technical silos as well as locations. The next-generation SAP monitoring solution as a service is bridging the gap in enterprise application performance management.
Looking for an integrated solution to help with many of the SAP Performance and Availability management needs? Try IT-Conductor, engineered as a cloud-based SAP Performance management and monitoring platform. We also offer SAP Performance management as a Service!