SAP operations are usually managed by in-house teams, outsourced to a Managed Service Provider (MSP), or both, utilizing a hybrid support model.
SAP monitoring and incident management are big parts of SAP support and regardless of who is responsible for it, it needs to be performed.
Now, let's revisit the top areas which require constant monitoring. In the next few weeks, we'll share our experiences around the top SAP Basis Monitoring areas.
We will use this main page as an anchor to the various topics below relisted from the blog BASIS or BASICS and will be added to as time goes on. The first topic will be included in this post.
Monitoring Areas
- Database Lock Waits & Deadlocks
- Spool Management
- Database Allocation & Utilization
- Backup / Restore Information
- Scheduled DB jobs
- DB Performance Analysis
- Application Server Resource Utilization: Processes, Dispatcher Queues
- Update Records
- tRFC & qRFC Queues
- System Logs (App, DB, OS)
- Background (Batch) Jobs
- Application Locks and Enqueue
- Users
- ABAP Dump Analysis
- Workload: Application Performance Analysis
- O/S Monitor
- Connectivity
- Security
Note: These monitoring areas are listed in no particular order of importance.
Database Lock Waits & Deadlocks
| Database Lockwaits and Deadlock |
SAP |
IT-Conductor |
-
Long waits and deadlocks typically arise from bulk or batch operations with mass updates or deletes, while other jobs or online activities are also working on the same set of table data.
-
DB locking and wait mechanisms can vary by database, but the essential concept is to synchronize access to data and ensure consistency. Application design has to consider both performance and data integrity in a parallel processing environment.
-
Let's use HANA as an example, please refer to 1999998 - FAQ: SAP HANA Lock Analysis for detailed background on the topic
-
Basis (DBA is implied) should care about two main types of situations:
-
Performance impacts of wait or blocked situations, bottlenecks, and contention
-
Deadlocks: transactions can get rolled back when there is lock wait timeout, deadlock detection, or if the application is designed to not wait for busy resources
|
-
ABAP: TCODE DB01 "Blocked Transactions" is under the Diagnostics → Locks section of DBACOCKPIT, or Lock Monitor
-
HANA Studio → Performance → Blocked Transactions
-
Database MiniChecks → Locks → (Internal or Transactional) scripts to check for various lock situations
-
SAP provides alerts of lock situations, which for transactional locks often need to be correlated back to the application enqueue objects. HANA has some historical SNAPSHOT of wait situations, but this is not supportive of historical top-down analysis unless someone is actively monitoring current DB locks and SAP enqueue locks in real-time.
|
Simultaneously monitor:
-
Active Batch jobs with selective criteria (Name, User, In-flight time)
-
Alerts for Long running transactions
-
Active users and their activities
-
Active SAP enqueue objects with their users/transaction
-
R3 Syslog for DB Deadlock events
-
DB alerts for long lock wait situations with Waiter and Transaction ID of Holder
-
SQL Statements
-
DB threads with waiting conditions (Mutex, Semaphore, Exclusive Locks, etc.)
-
Dialog and DB response times
Any of the monitors above can have an exception (known in IT-Conductor as Threshold Overrides or for an Alert matching a filter called Object Template) which triggers an Alert and optional Notification. Furthermore, a Recovery Action, such as a SQL query or MiniCheck report triggered when the exception is caught. This can be used for further analysis but gives historical context along with all the metrics and alerts monitored above.
|

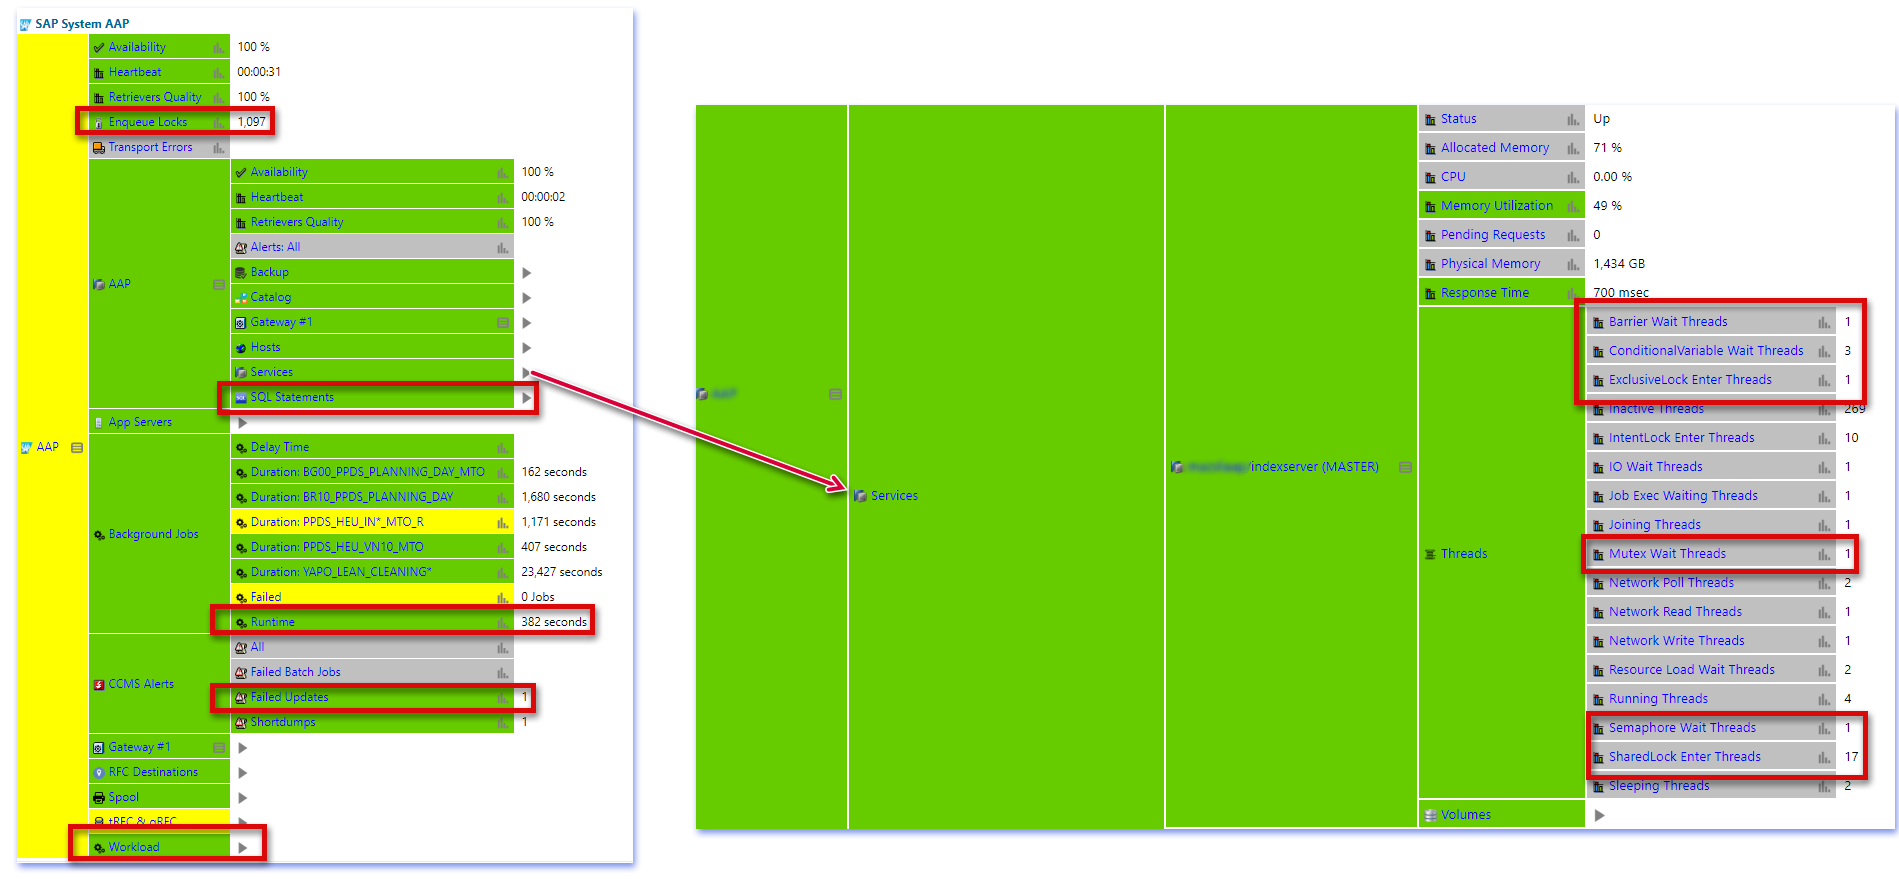
Figure 1: IT-Conductor SAP Monitoring Locks and Performance
|